The Meter Is Running: What a Build Actually Costs
We built the same 19-row filter three ways (Spark via Pipeline Builder, lightweight polars via Code Repositories, DataFusion via a Faster pipeline) and read the meter on each. Verified live: identical logic cost 40 to 52 seconds on Spark, 20 seconds of job time on single-machine polars, and 6 seconds on DataFusion with the Small compute profile. We captured the creation-time feature matrix (what Faster cannot do), the deploy-time compute profile dial (Small is 1 core and 7.5 GB), the write format list (Default or PARQUET, nothing else), and the uncomfortable truth that on small jobs the queue and startup phases cost more than the query.
- FM-PB-05 (transactions, first Spark build). The numbers from that module are the baseline here.
- FM-PB-06 (lightweight polars job). Its telemetry is the comparison point.
Field notes from the Avinyr lab. Everything below was observed live on 2026-09-03 in Pipeline Builder, Builds, and dataset History on our cloud enrollment. The data is the same synthetic work order stream from FM-PB-05, labeled synthetic since the day we made it. Every screenshot is ours.
[ READ THIS FIRST: WHAT THIS MODULE IS ]
Every build you run spends compute, and compute is the bill. Most practitioners never look at the meter because the platform quietly pays it until someone asks why the enrollment is slow or expensive. This module teaches you to read the meter before that conversation happens.
We took the simplest pipeline in this manual, the 19-row filter from FM-PB-05, and ran it through all three engines this lab has touched: Spark boards, a single-machine polars transform, and a DataFusion-backed "Faster" pipeline. Same rows. Same predicate: keep work orders where resolution_days is not negative. Three different cost profiles. By the end you will know where the duration numbers live, what a compute profile is, which features you give up for speed, and why the slowest part of a small build has nothing to do with your data.
[ WHAT YOU WILL HAVE AT THE END ]
One pipeline (FM-PB-07 datafusion filter) running on the Faster compute choice, deployed, with one output dataset (work_orders_stream_clean_df, 18 rows, trap row removed). A build report you can read line by line. And one comparison table you will reuse for the rest of the manual:
| Route | Where | Build wall time | Job duration |
|---|---|---|---|
| FM-PB-05 | Pipeline Builder, Spark | 40s and 52s (two runs) | not isolated |
| FM-PB-06 | Code Repositories, lightweight polars | 30s | 20s (9s of it "Ran") |
| FM-PB-07 | Pipeline Builder, Faster (DataFusion), Small profile | 13s | 6s |
Identical input, identical filter. The engine is the only variable.
[ STEP 1: READ THE METER ON A JOB YOU ALREADY RAN ]
Before spending new compute, learn where the meter lives by reading the FM-PB-06 job. Open that output dataset, go to History, and open the transaction. The Job progress bar breaks the run into phases. The build report goes further: stage timings, and a Build info panel with Duration, an Estimated value, and a "Typically" figure on the job row.

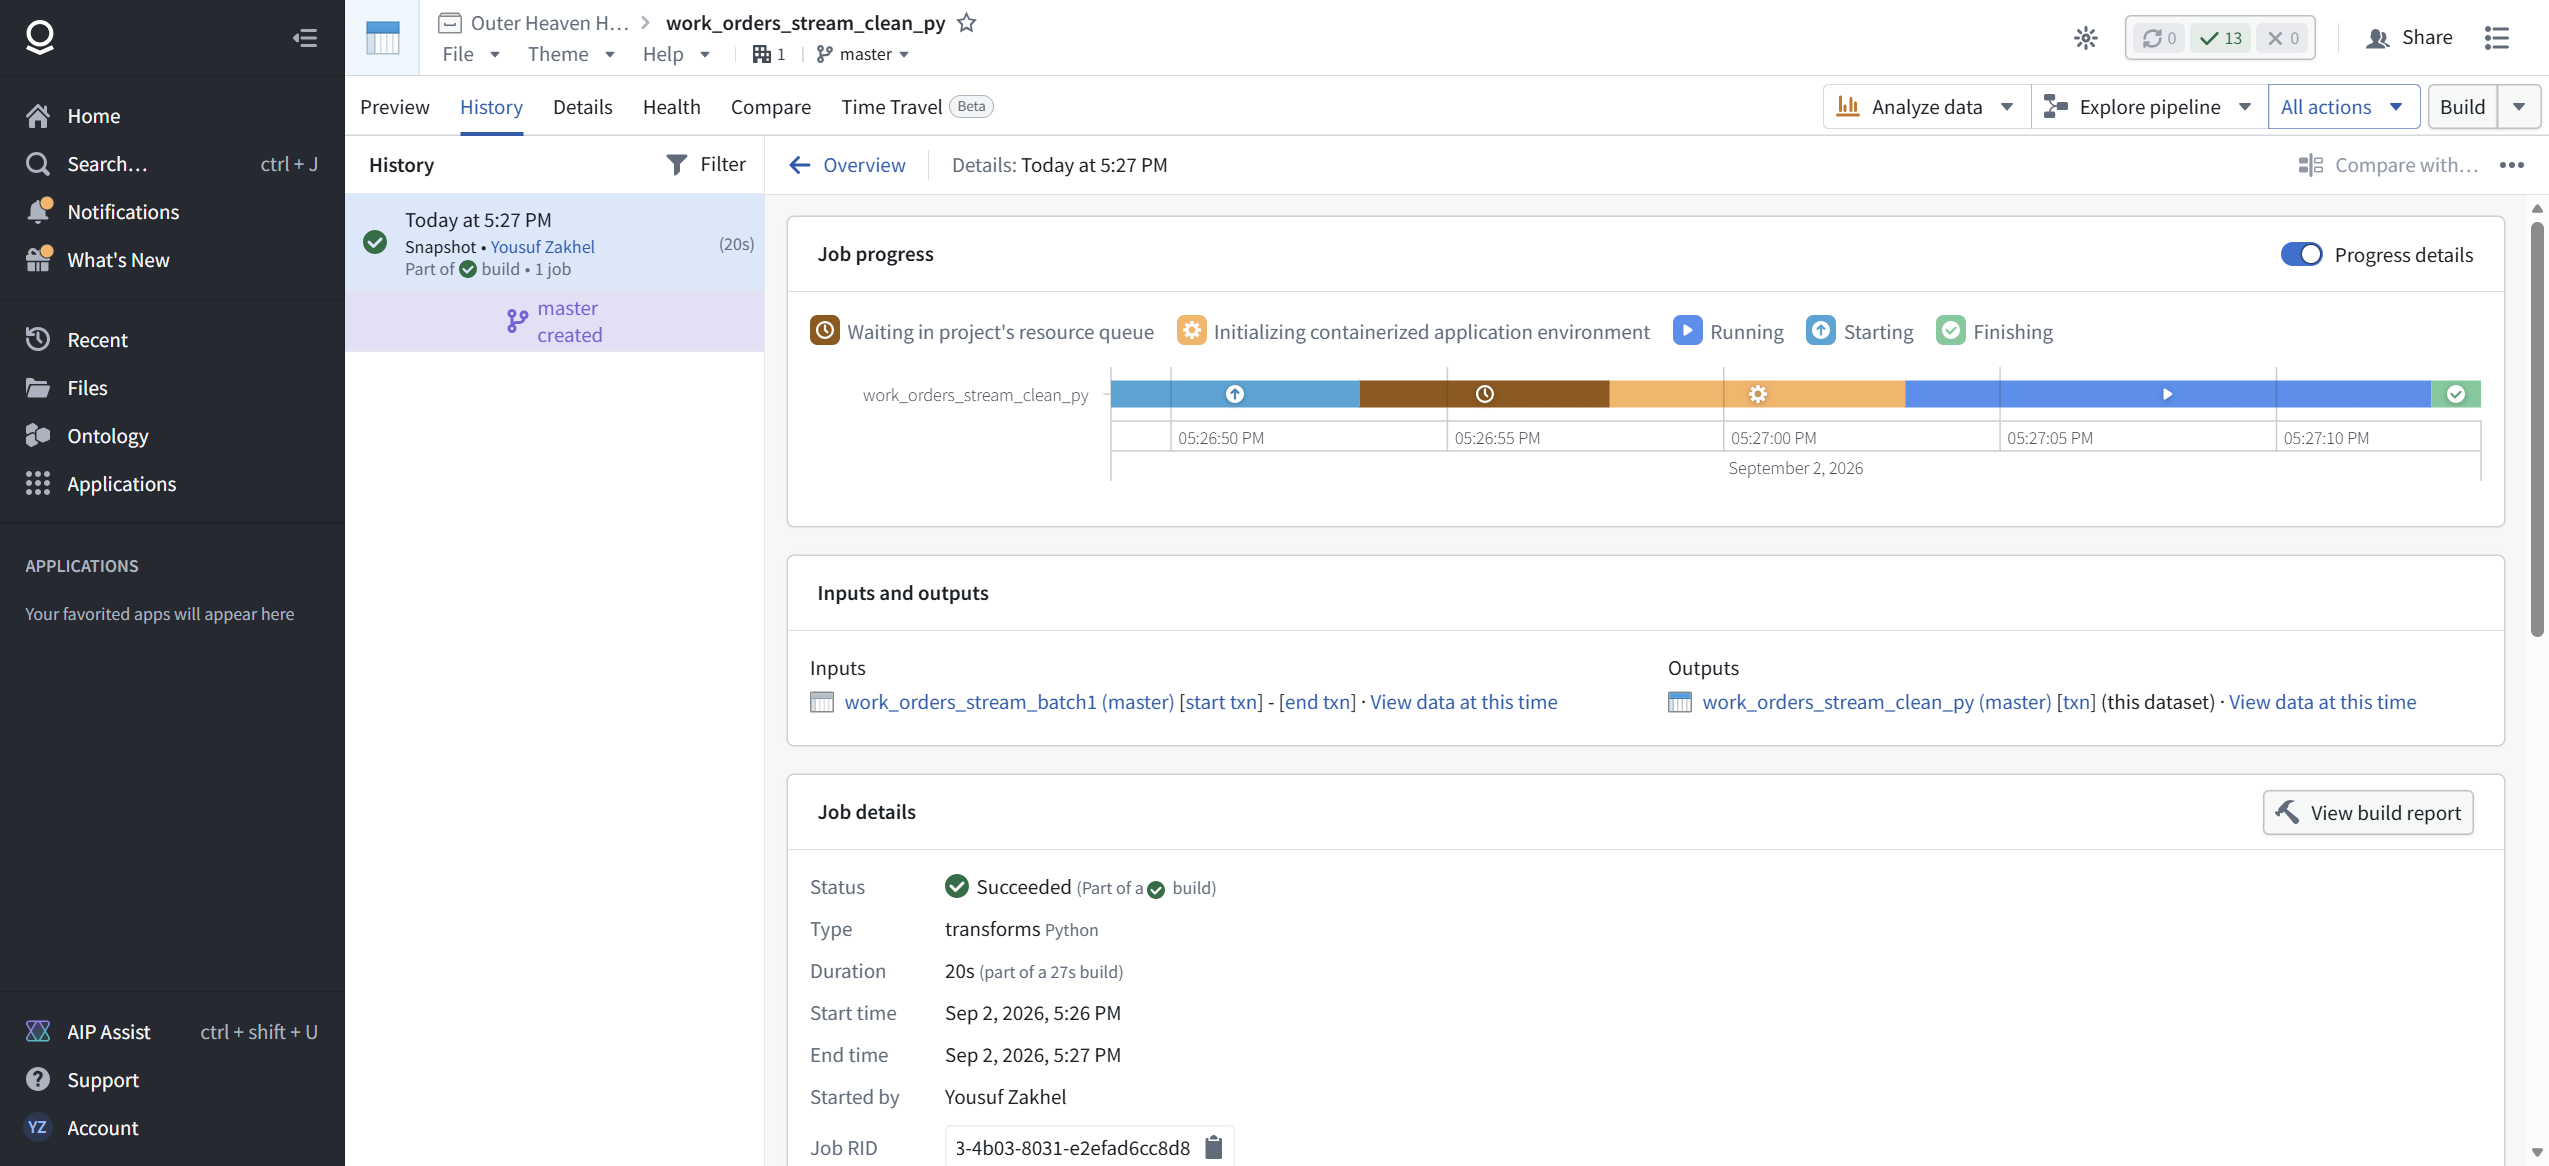
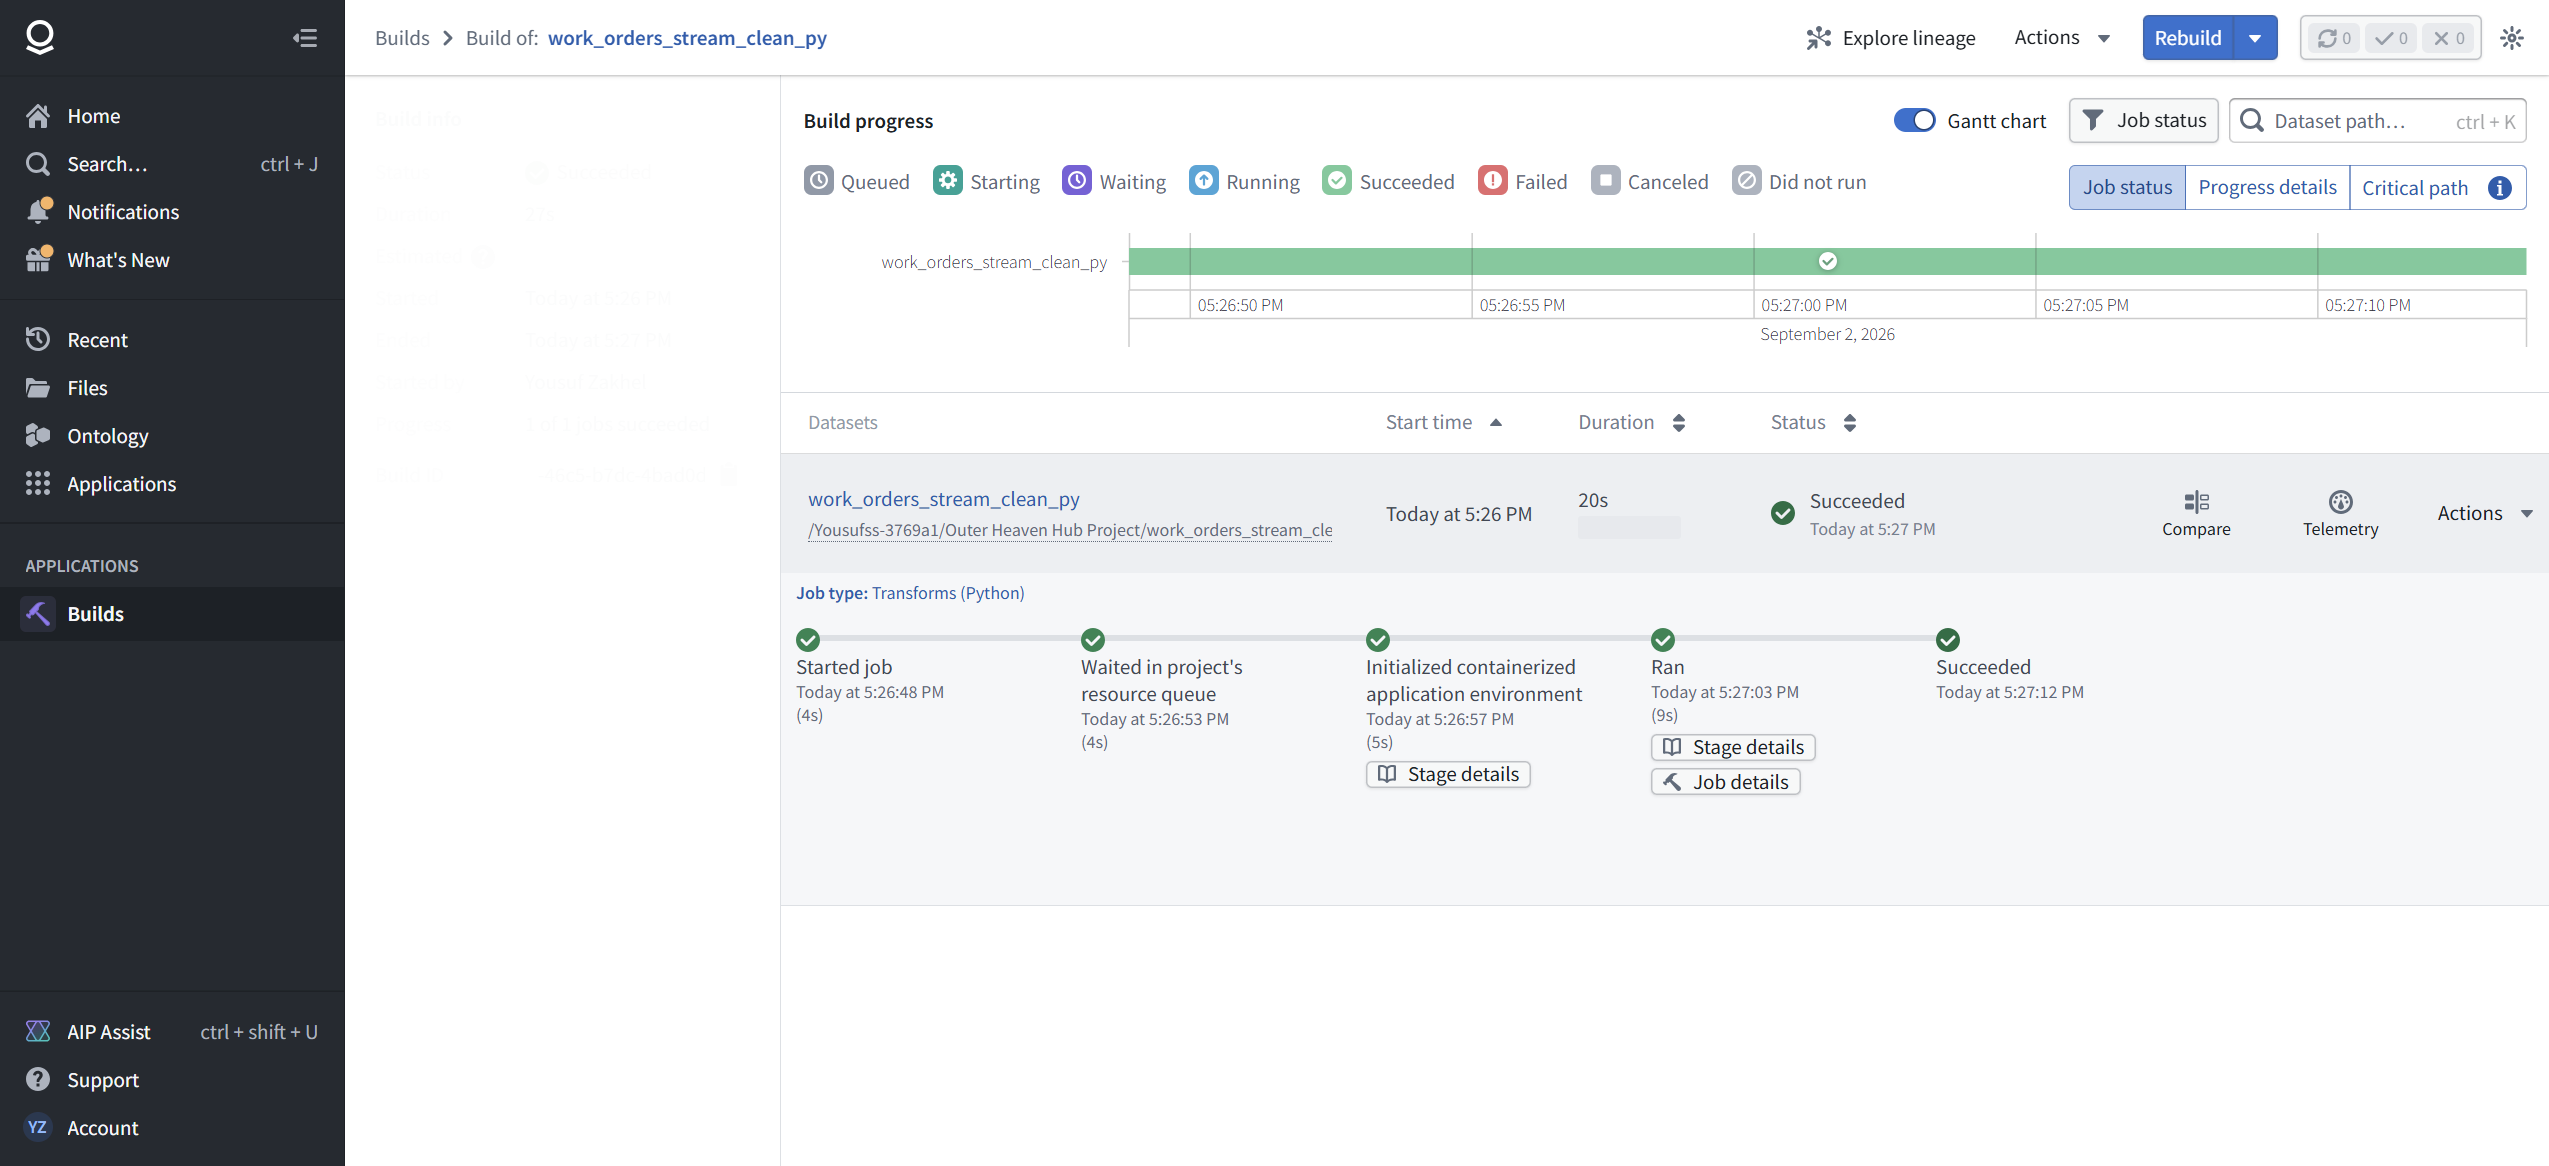

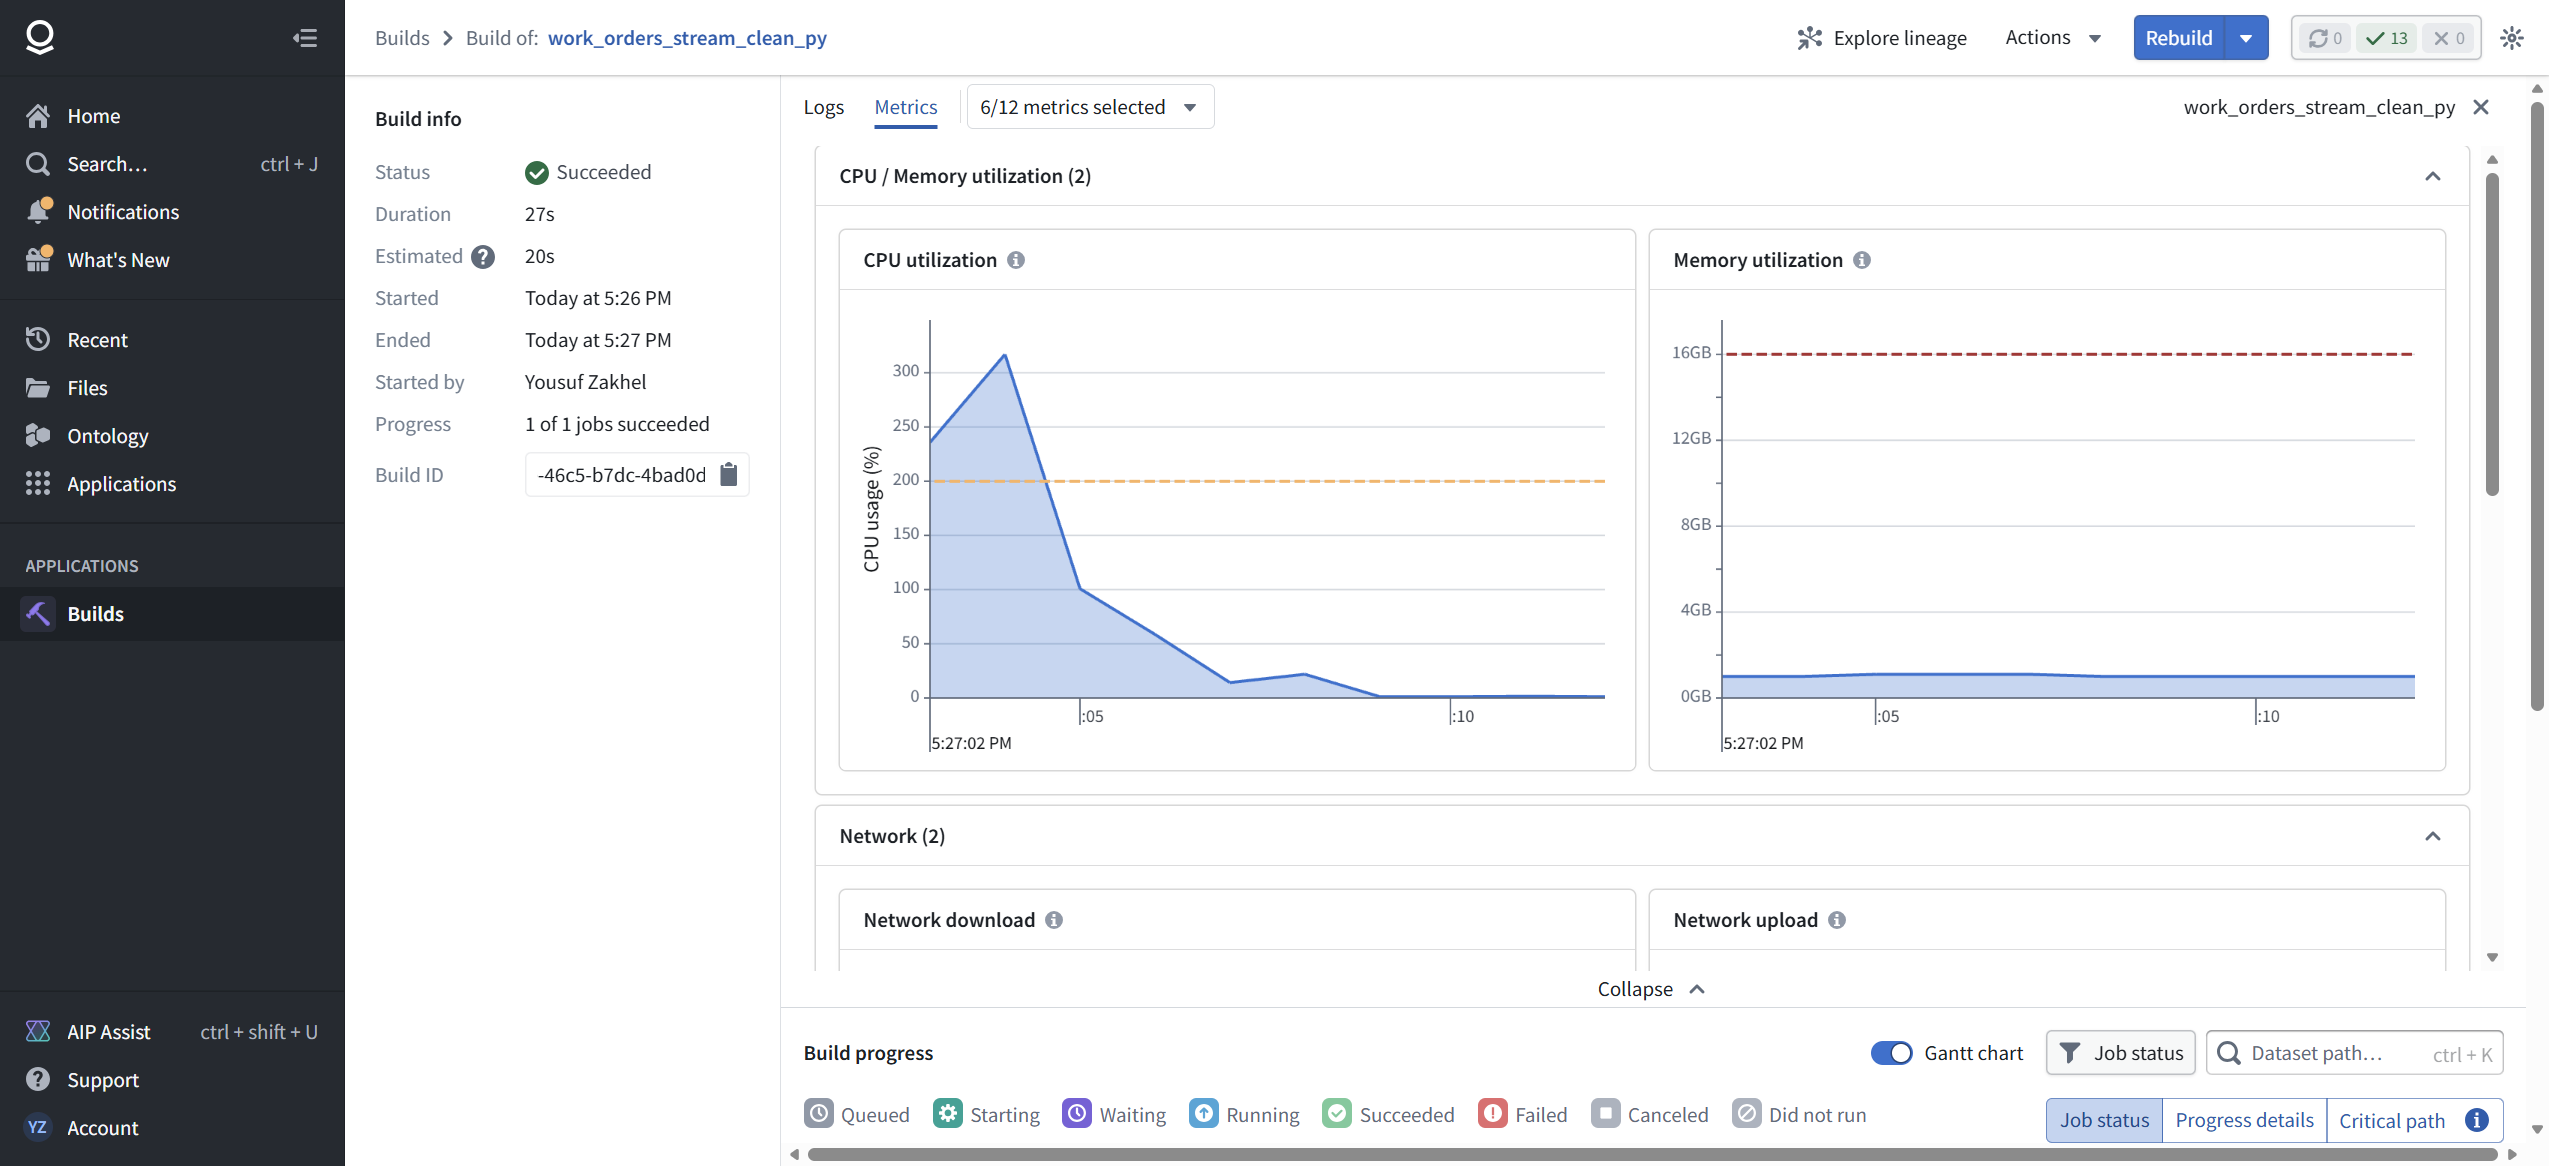
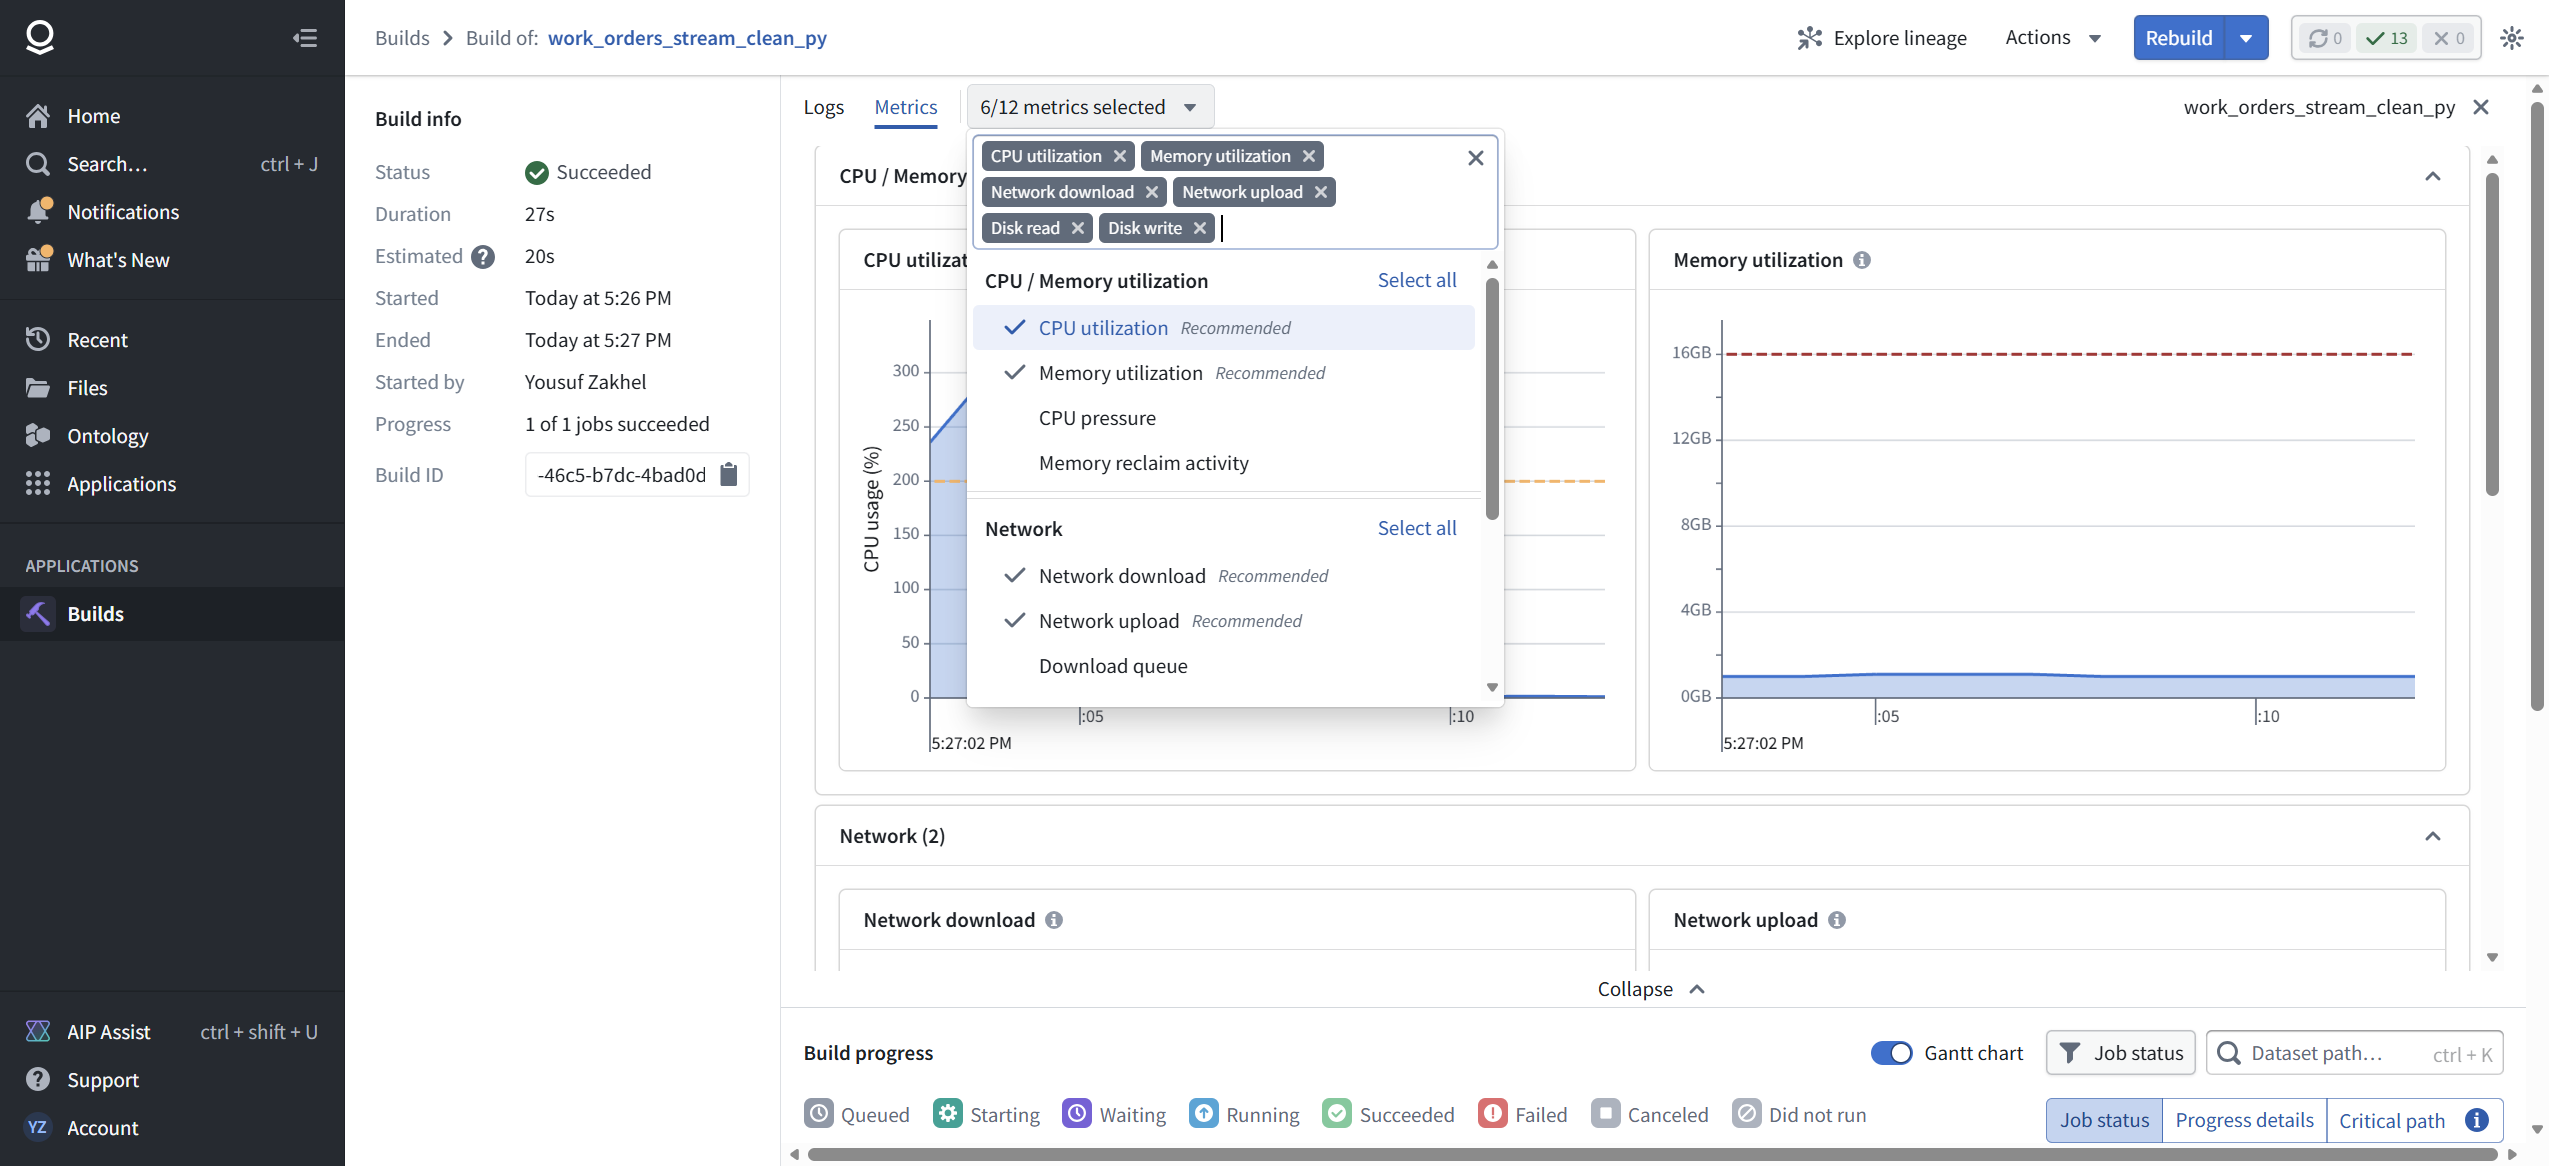
That job also had a Telemetry view with real resource graphs: twelve metrics, including CPU that spiked to about 310% against a 200% reference line and a 16 GB memory ceiling. Remember this. It matters in Step 6.
[ STEP 2: ENGINE CHOICE IS A CREATION-TIME DECISION ]
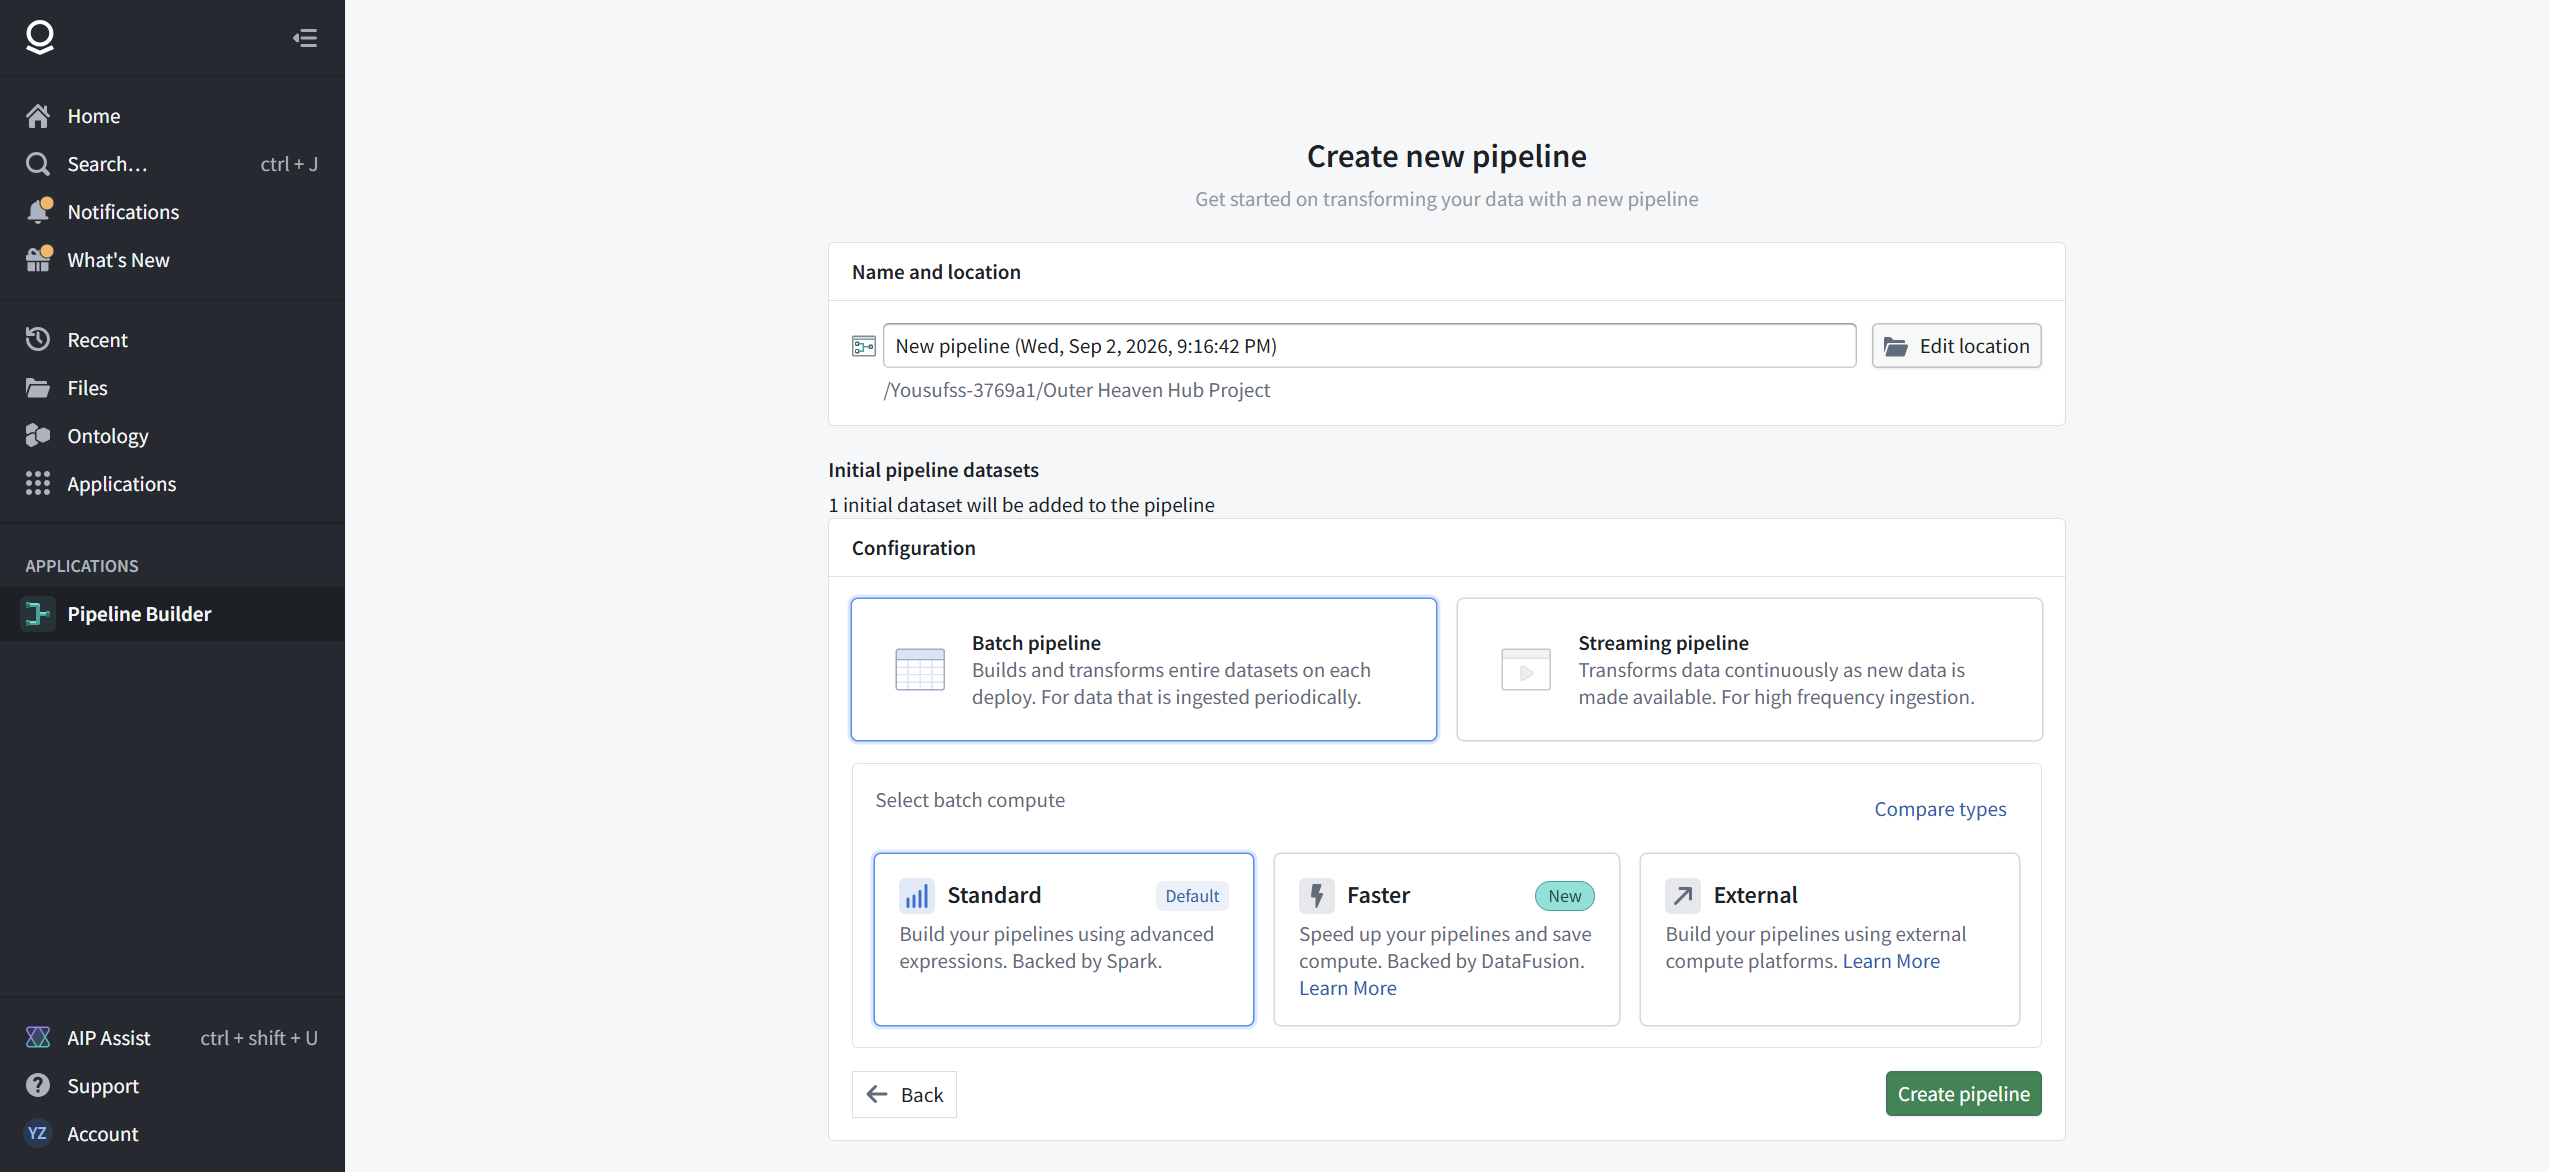
New pipelines ask how you want to compute. The choices are Standard, Faster, and External. Faster's pitch, verbatim: "Speed up your pipelines and save compute. Backed by DataFusion."
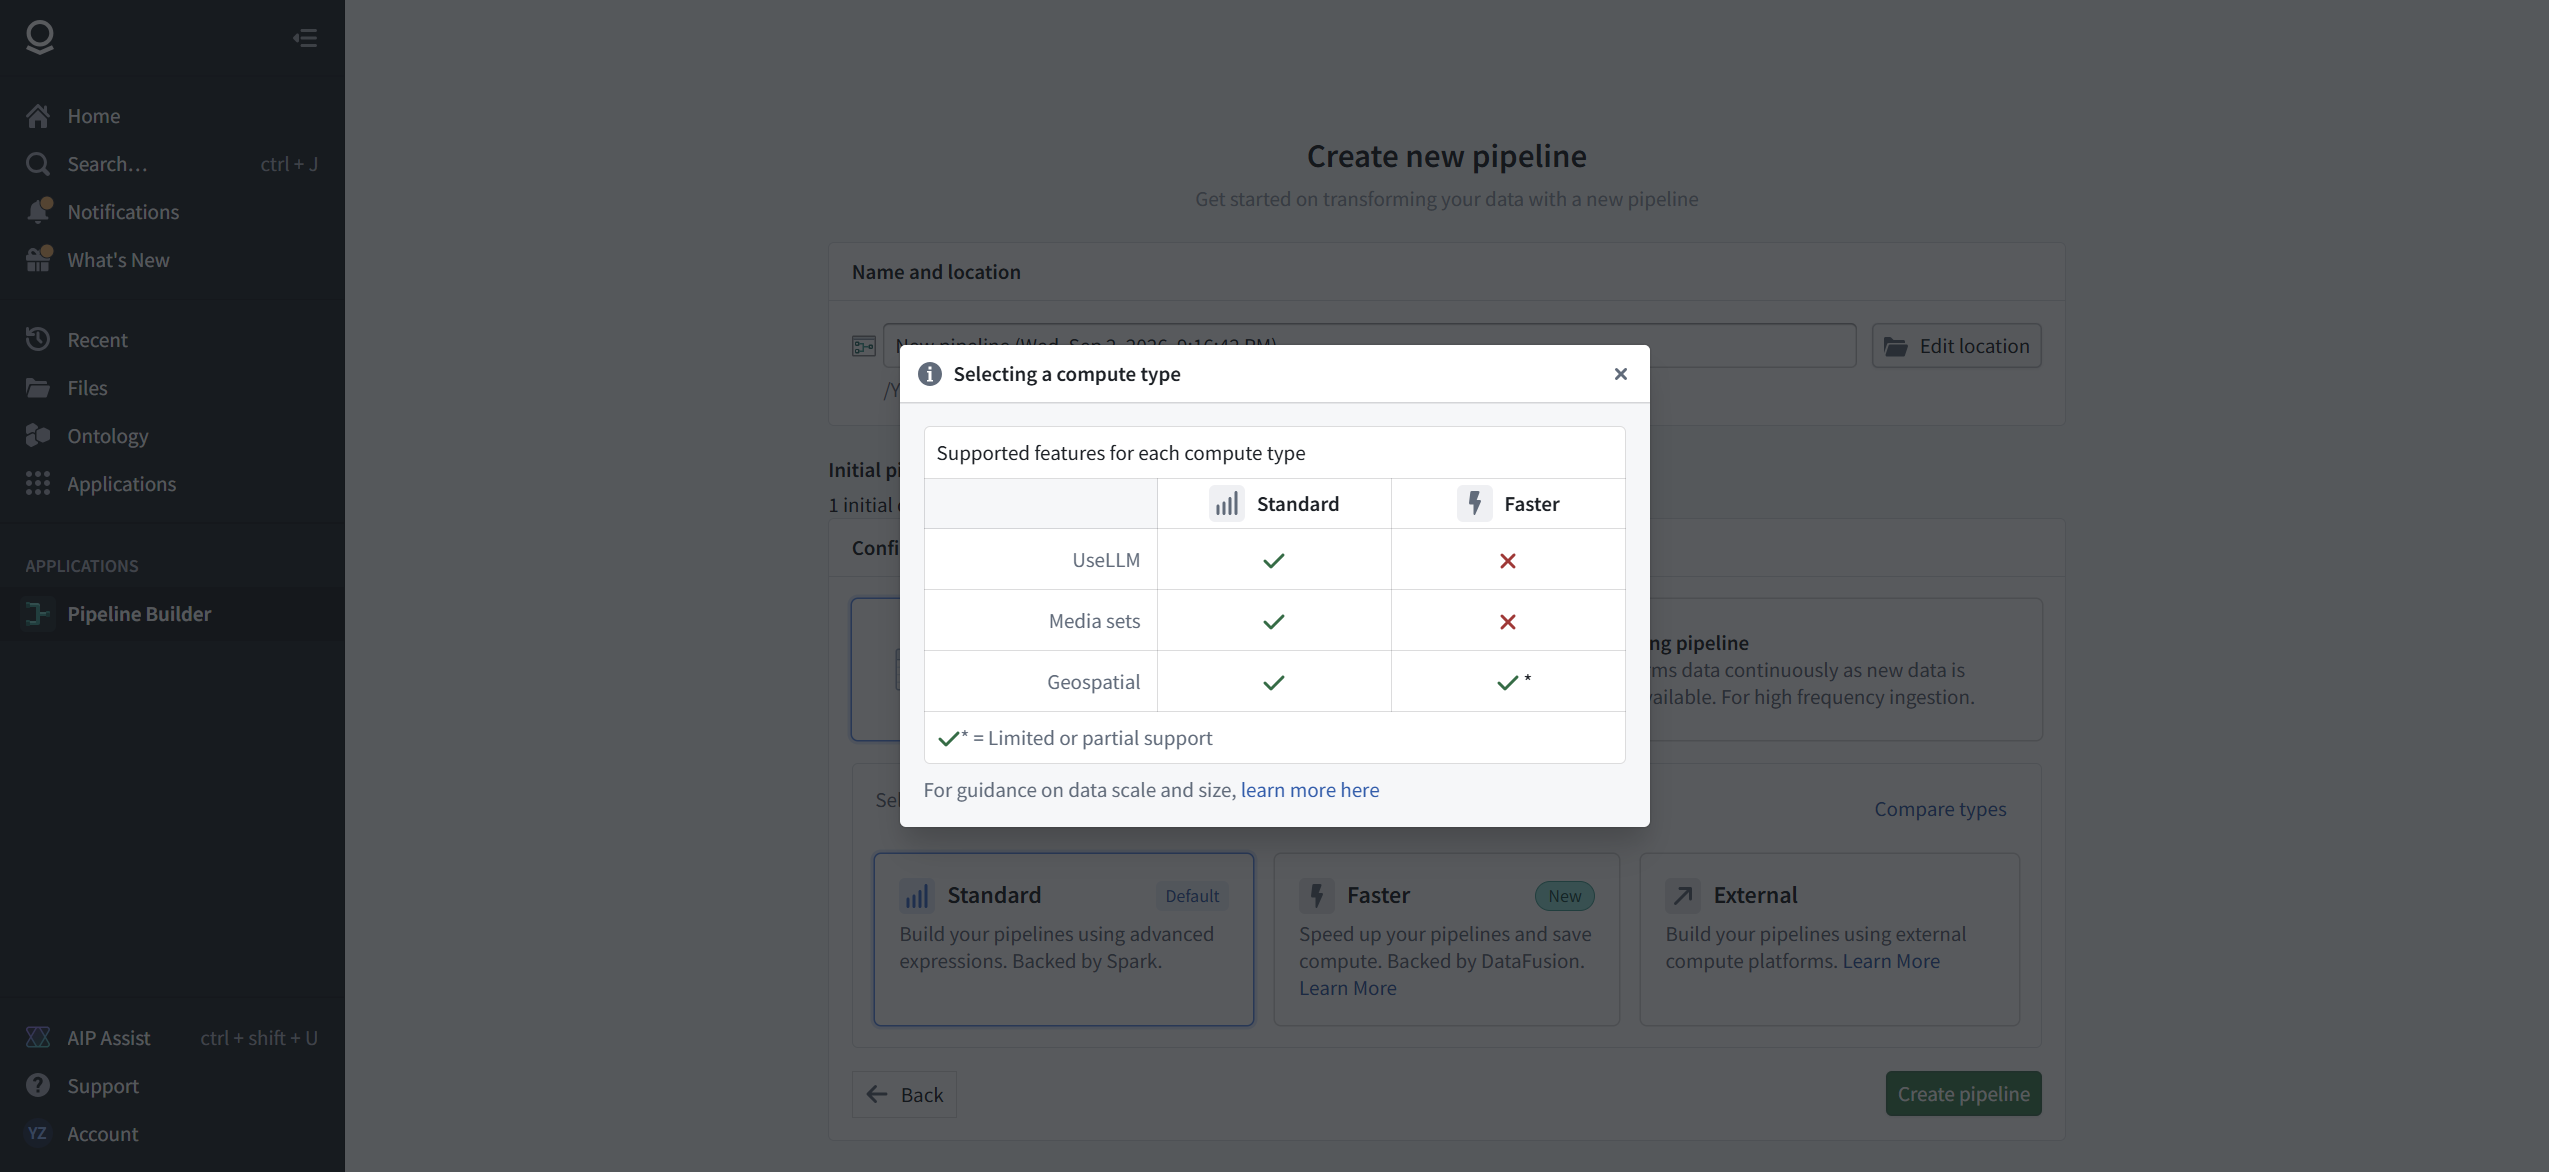
Open the comparison before you click. The matrix is the honest part of the product: Faster cannot do everything Standard can. On this enrollment, Use LLM and Media sets are unavailable on Faster, and Geospatial carries a limited-support asterisk. You are trading capability for speed, and you are trading it at creation time, not later.
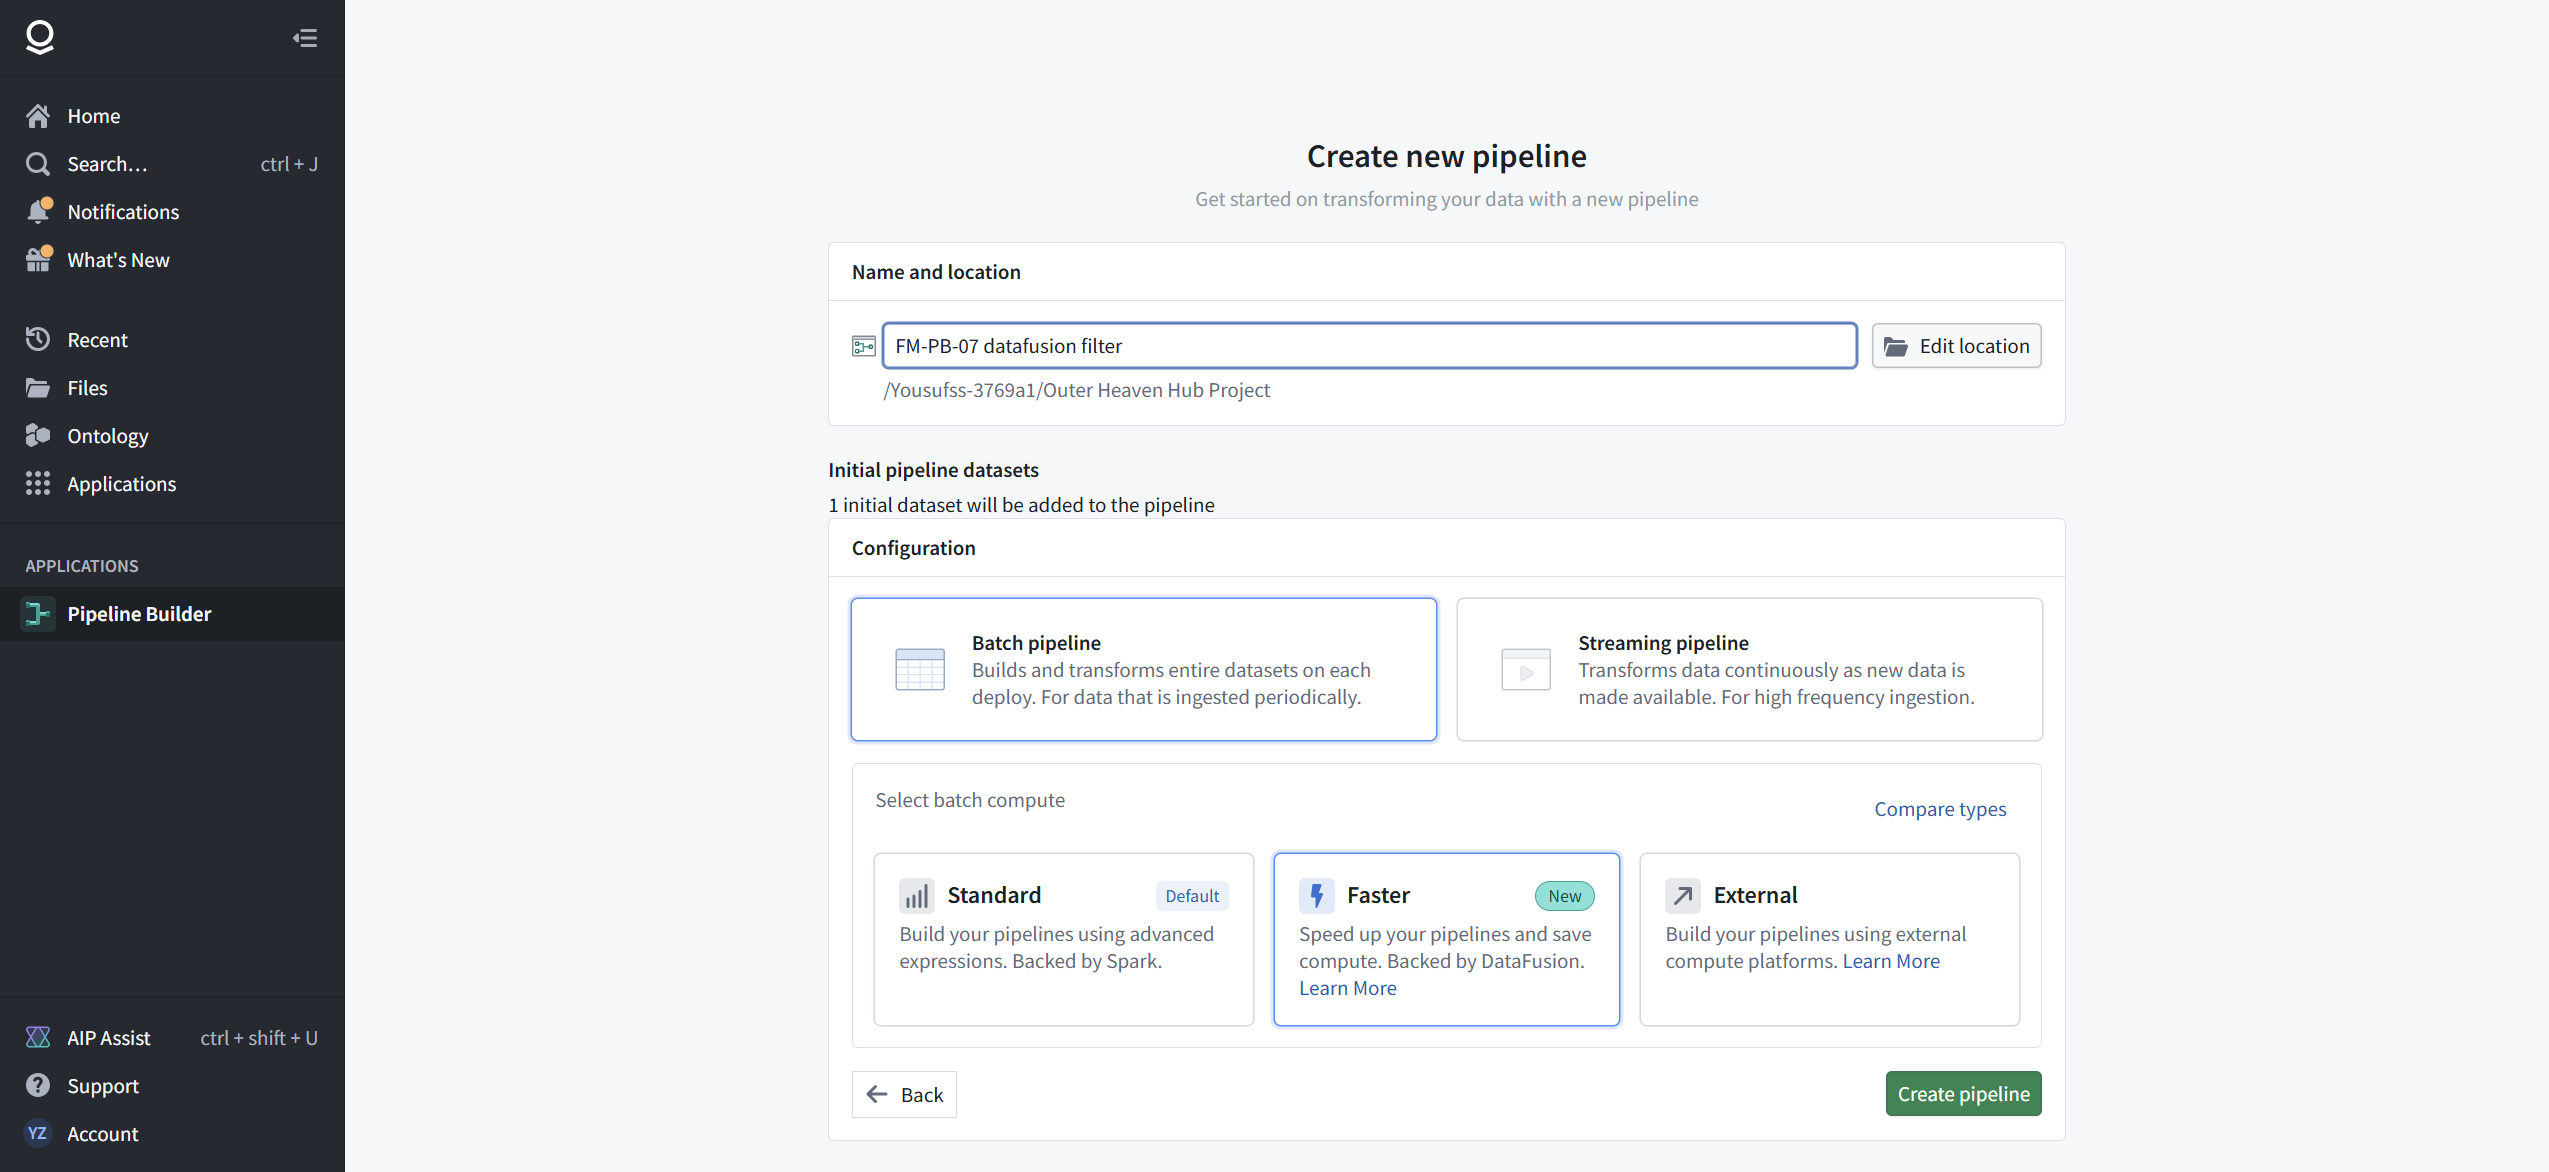
We chose Faster, named the pipeline FM-PB-07 datafusion filter, and got a header badge that says Faster (New). The (New) is doing quiet work: this is the direction Palantir is investing in, and the badge will not be there forever.

[ STEP 3: BUILD THE SAME FILTER ]
Input: work_orders_stream_batch1. One Filter board: keep rows that match all conditions, resolution_days greater than or equal to 0. The board auto-inferred the integer type. This is exactly the FM-PB-05 predicate, so any difference in what happens next is engine, not logic.
Then Add a pipeline output. The panel offers four output kinds: Dataset, Object type, Link type, Media set. Choose Dataset.
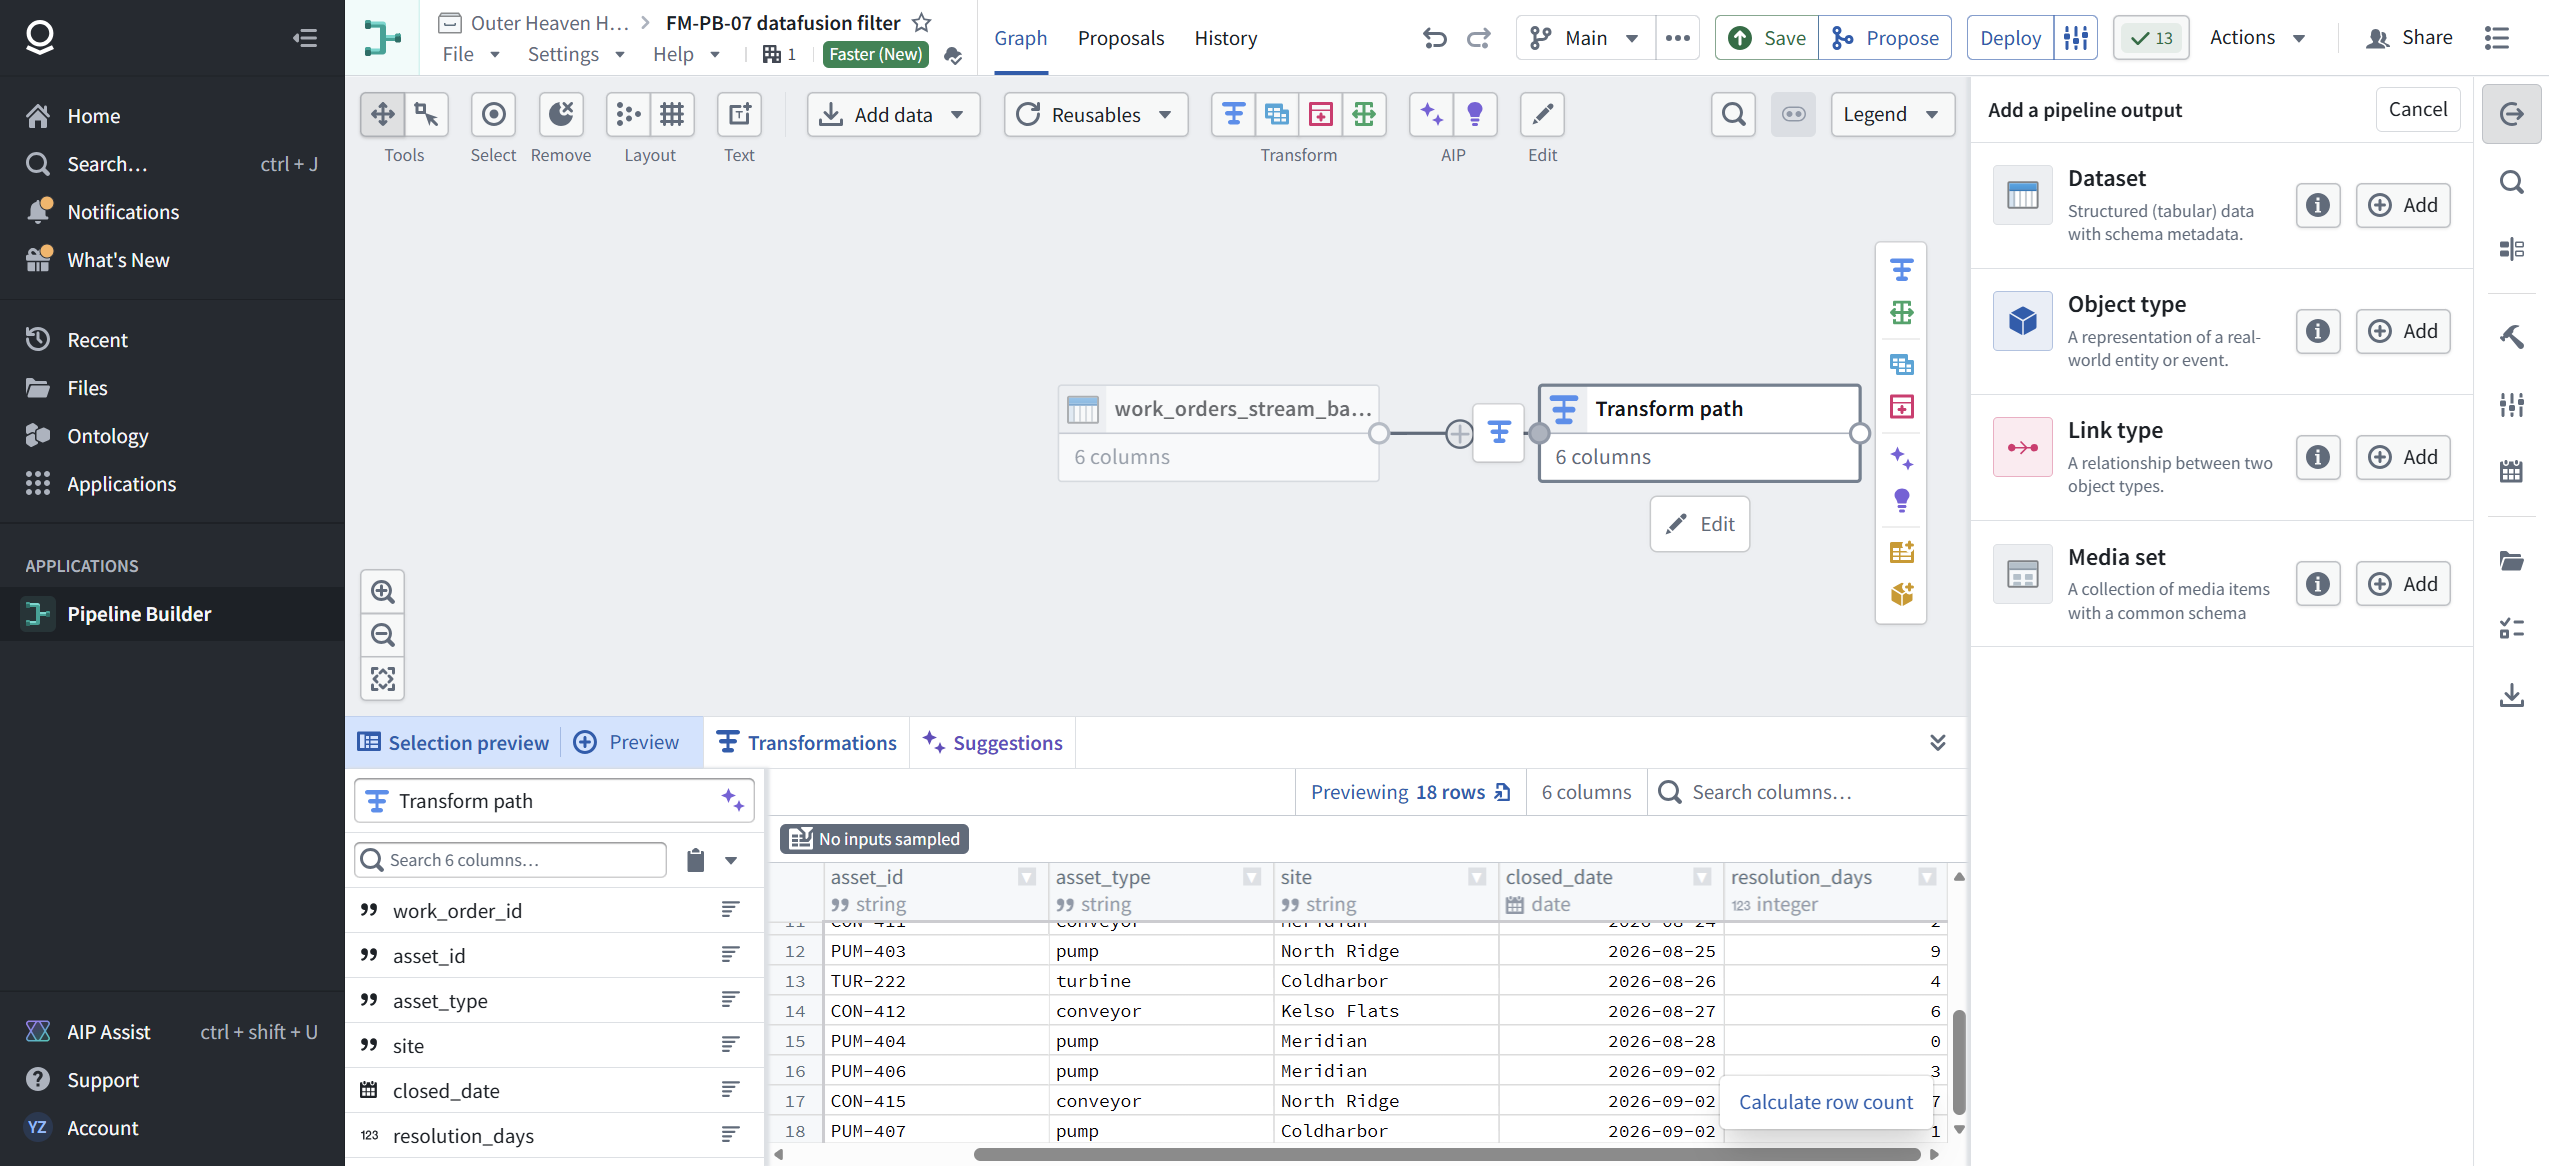
Here is where the flow surprises people. No save dialog appears. An output node drops onto the graph named "New dataset" plus a timestamp, and the right panel says "Output will be created after first build" with 6/6 columns mapped.
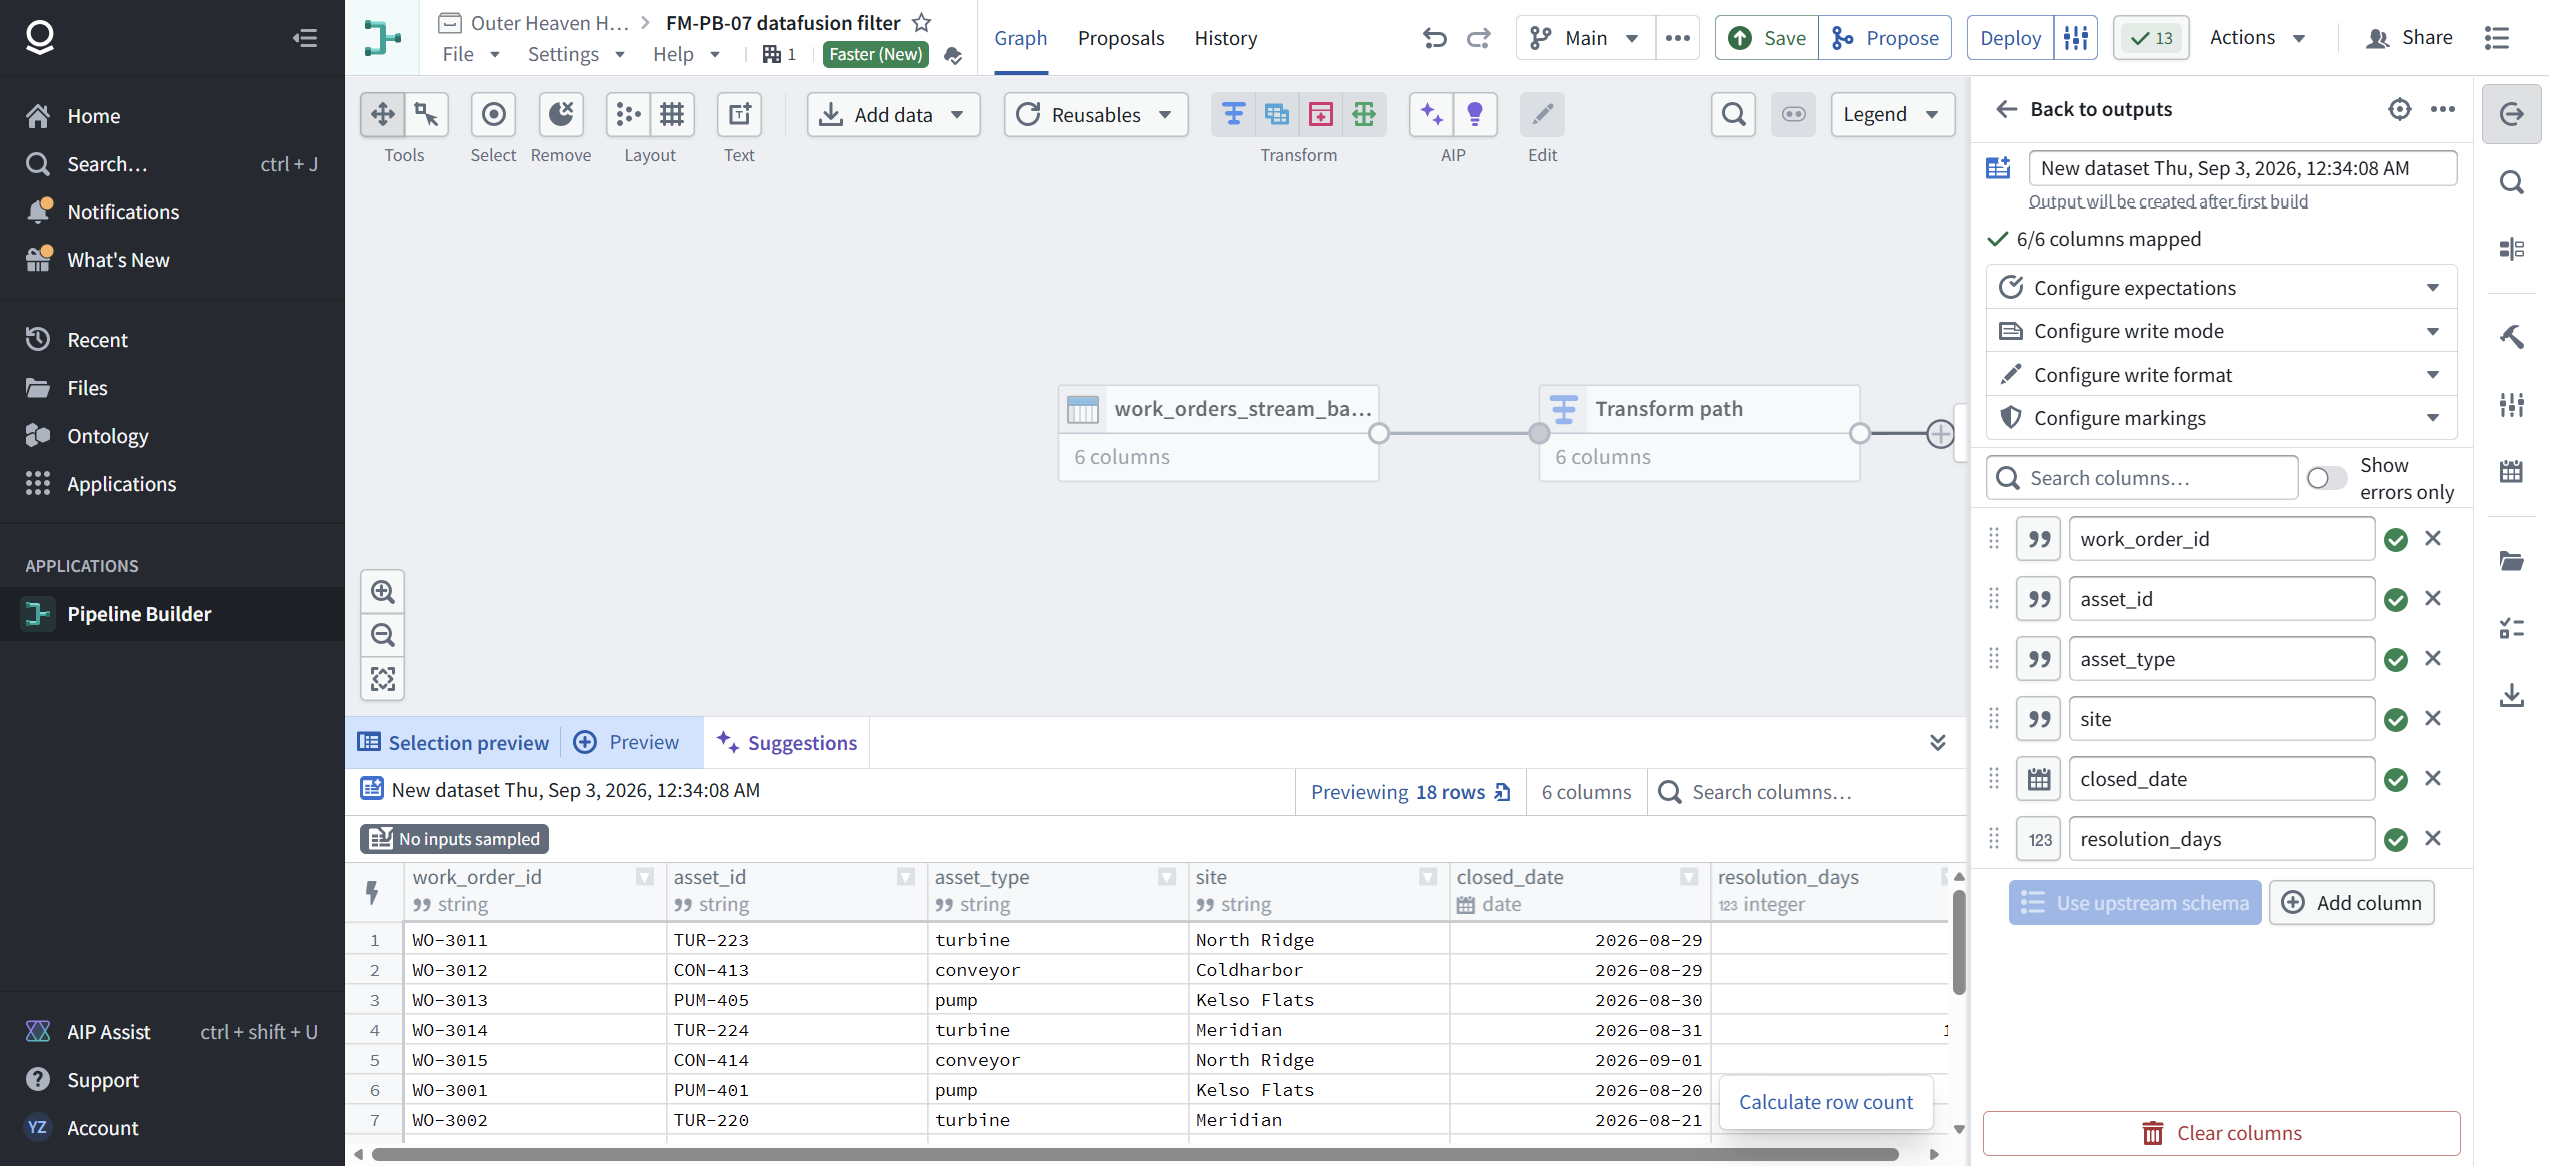
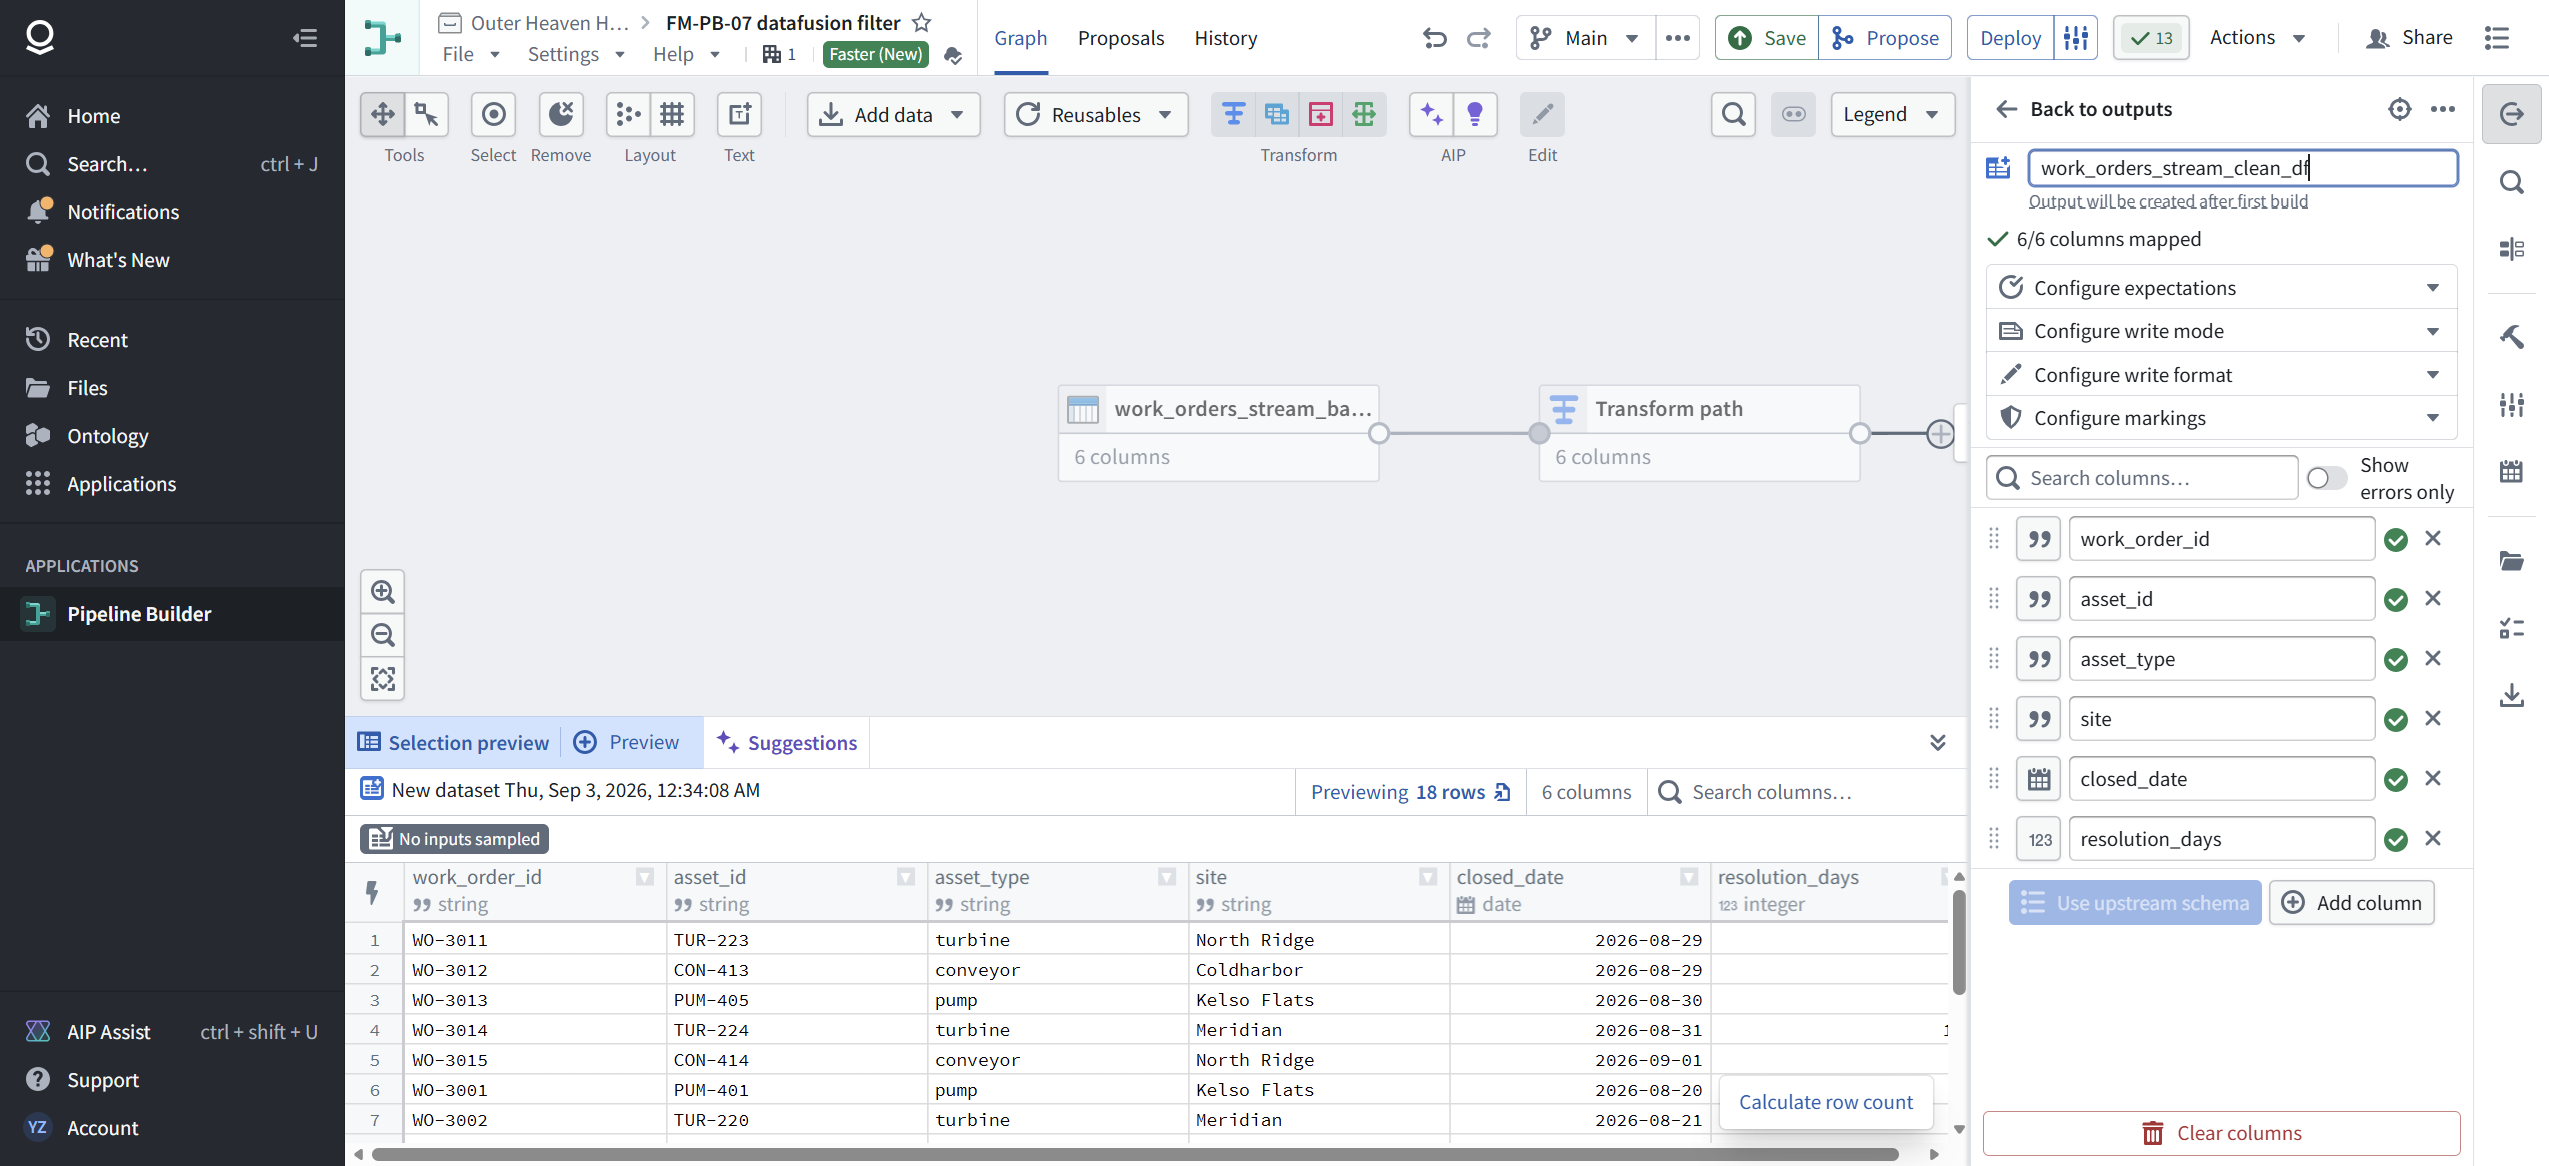
Field repair FR-1: that unnamed node is normal. The name is an editable input at the top of the right panel, pre-filled with the timestamp. Rename it there (we used work_orders_stream_clean_df), then Save. The dataset does not exist in your project until the first build writes it. You are naming a promise, not a file.
[ STEP 4: PROBE THE OUTPUT CONTRACT BEFORE YOU DEPLOY ]
The output panel has four configuration sections. We opened Configure write format. The popover says "Choose from supported output dataset write formats here" and the dropdown contains exactly two values: Default and PARQUET.
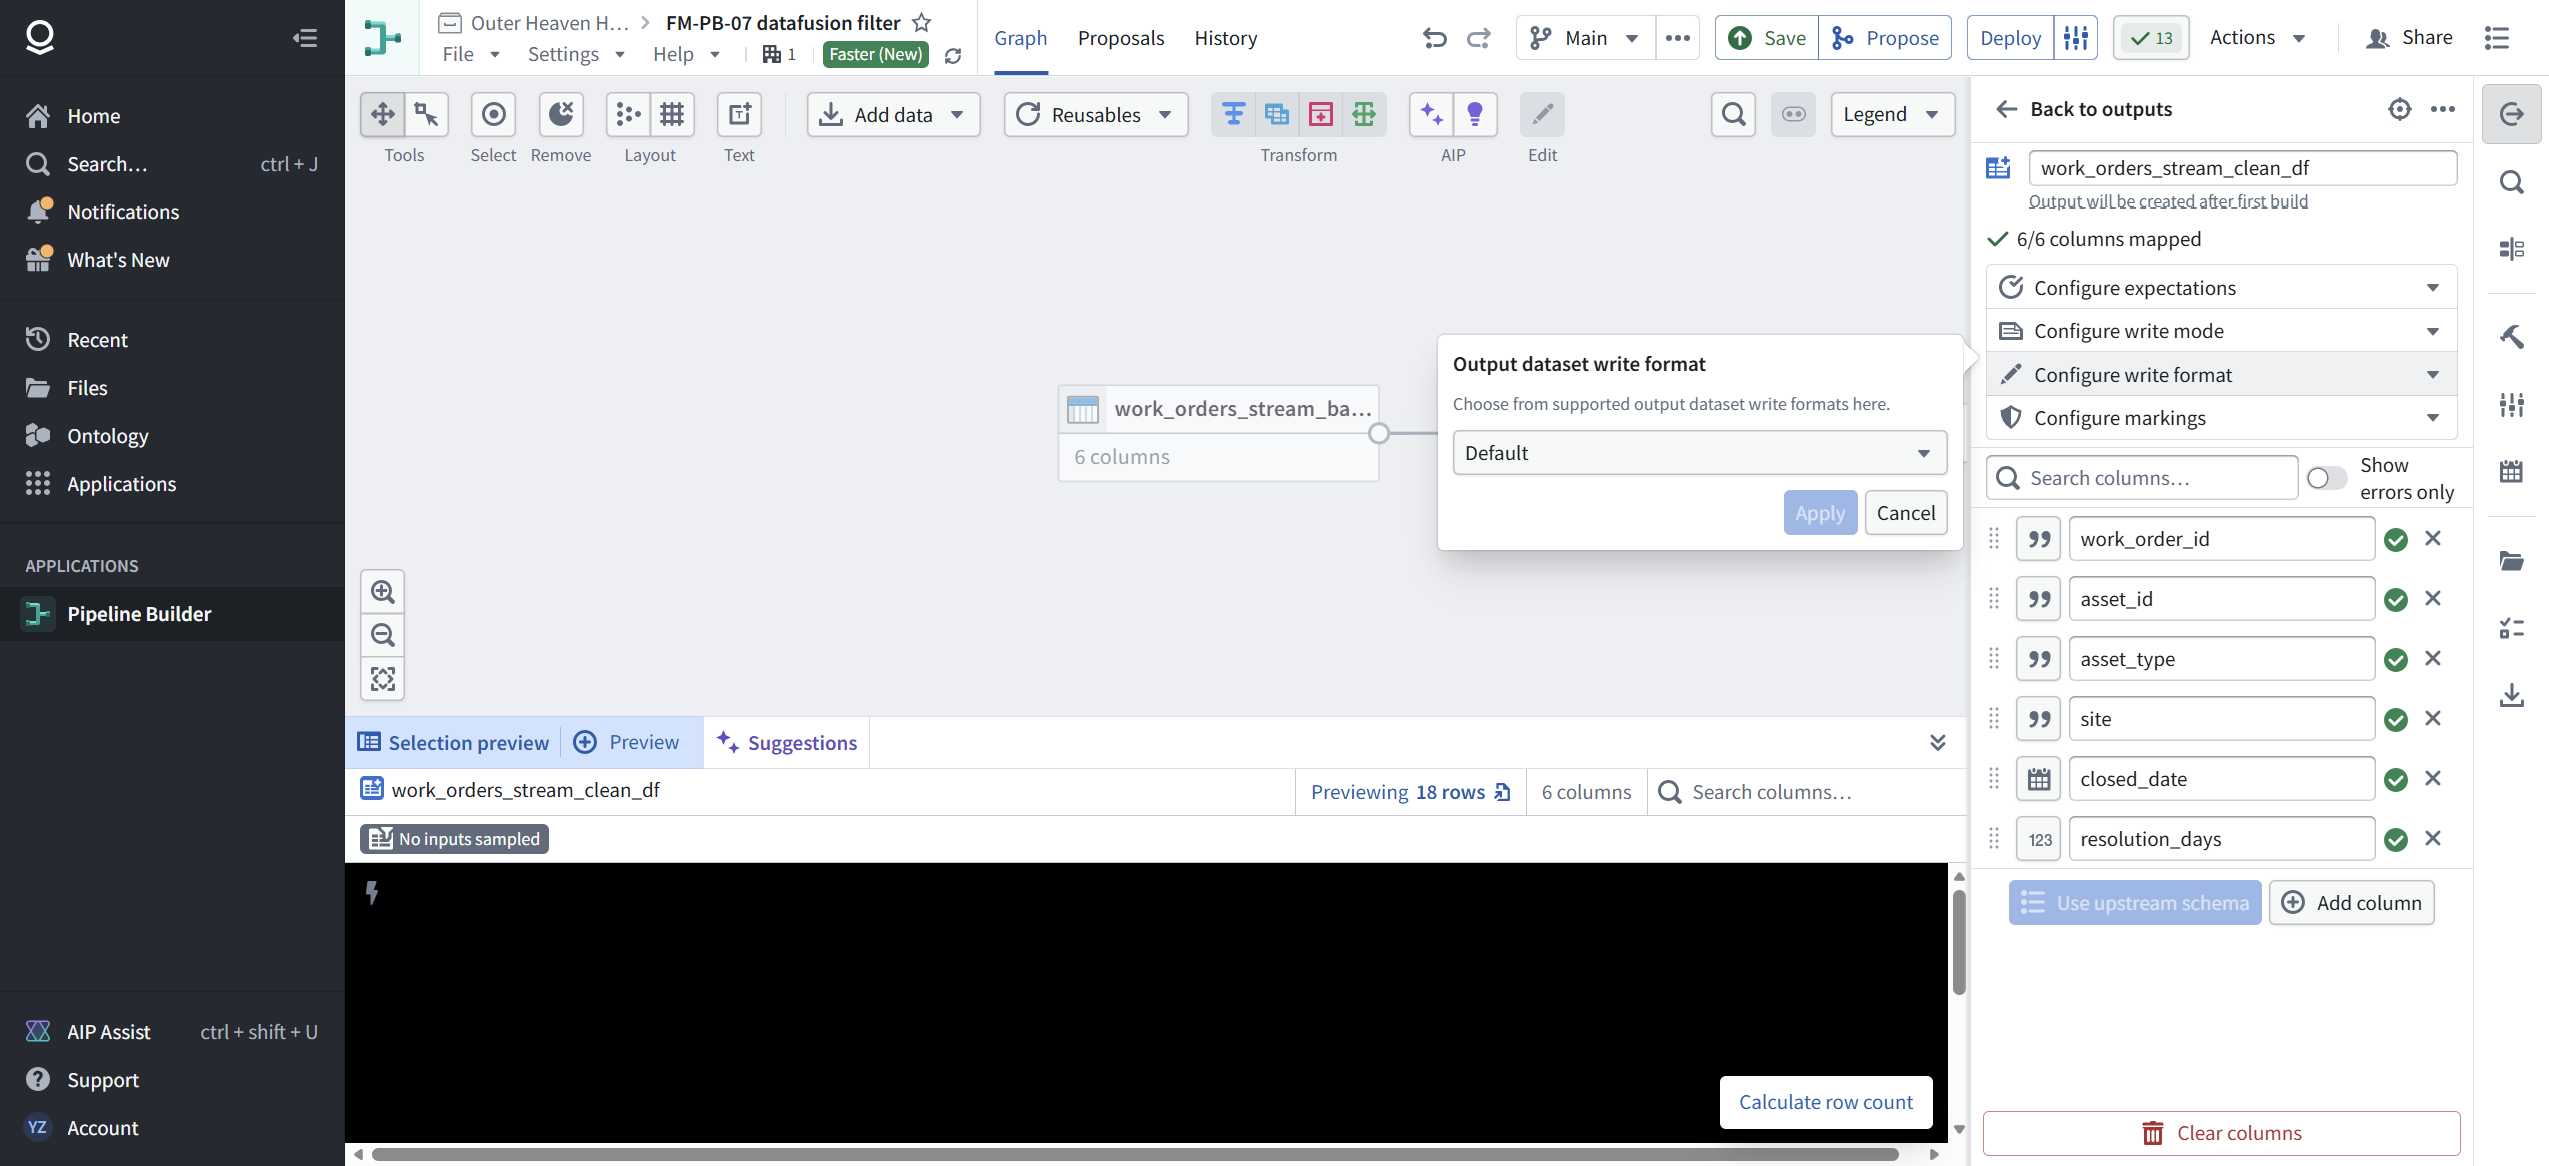
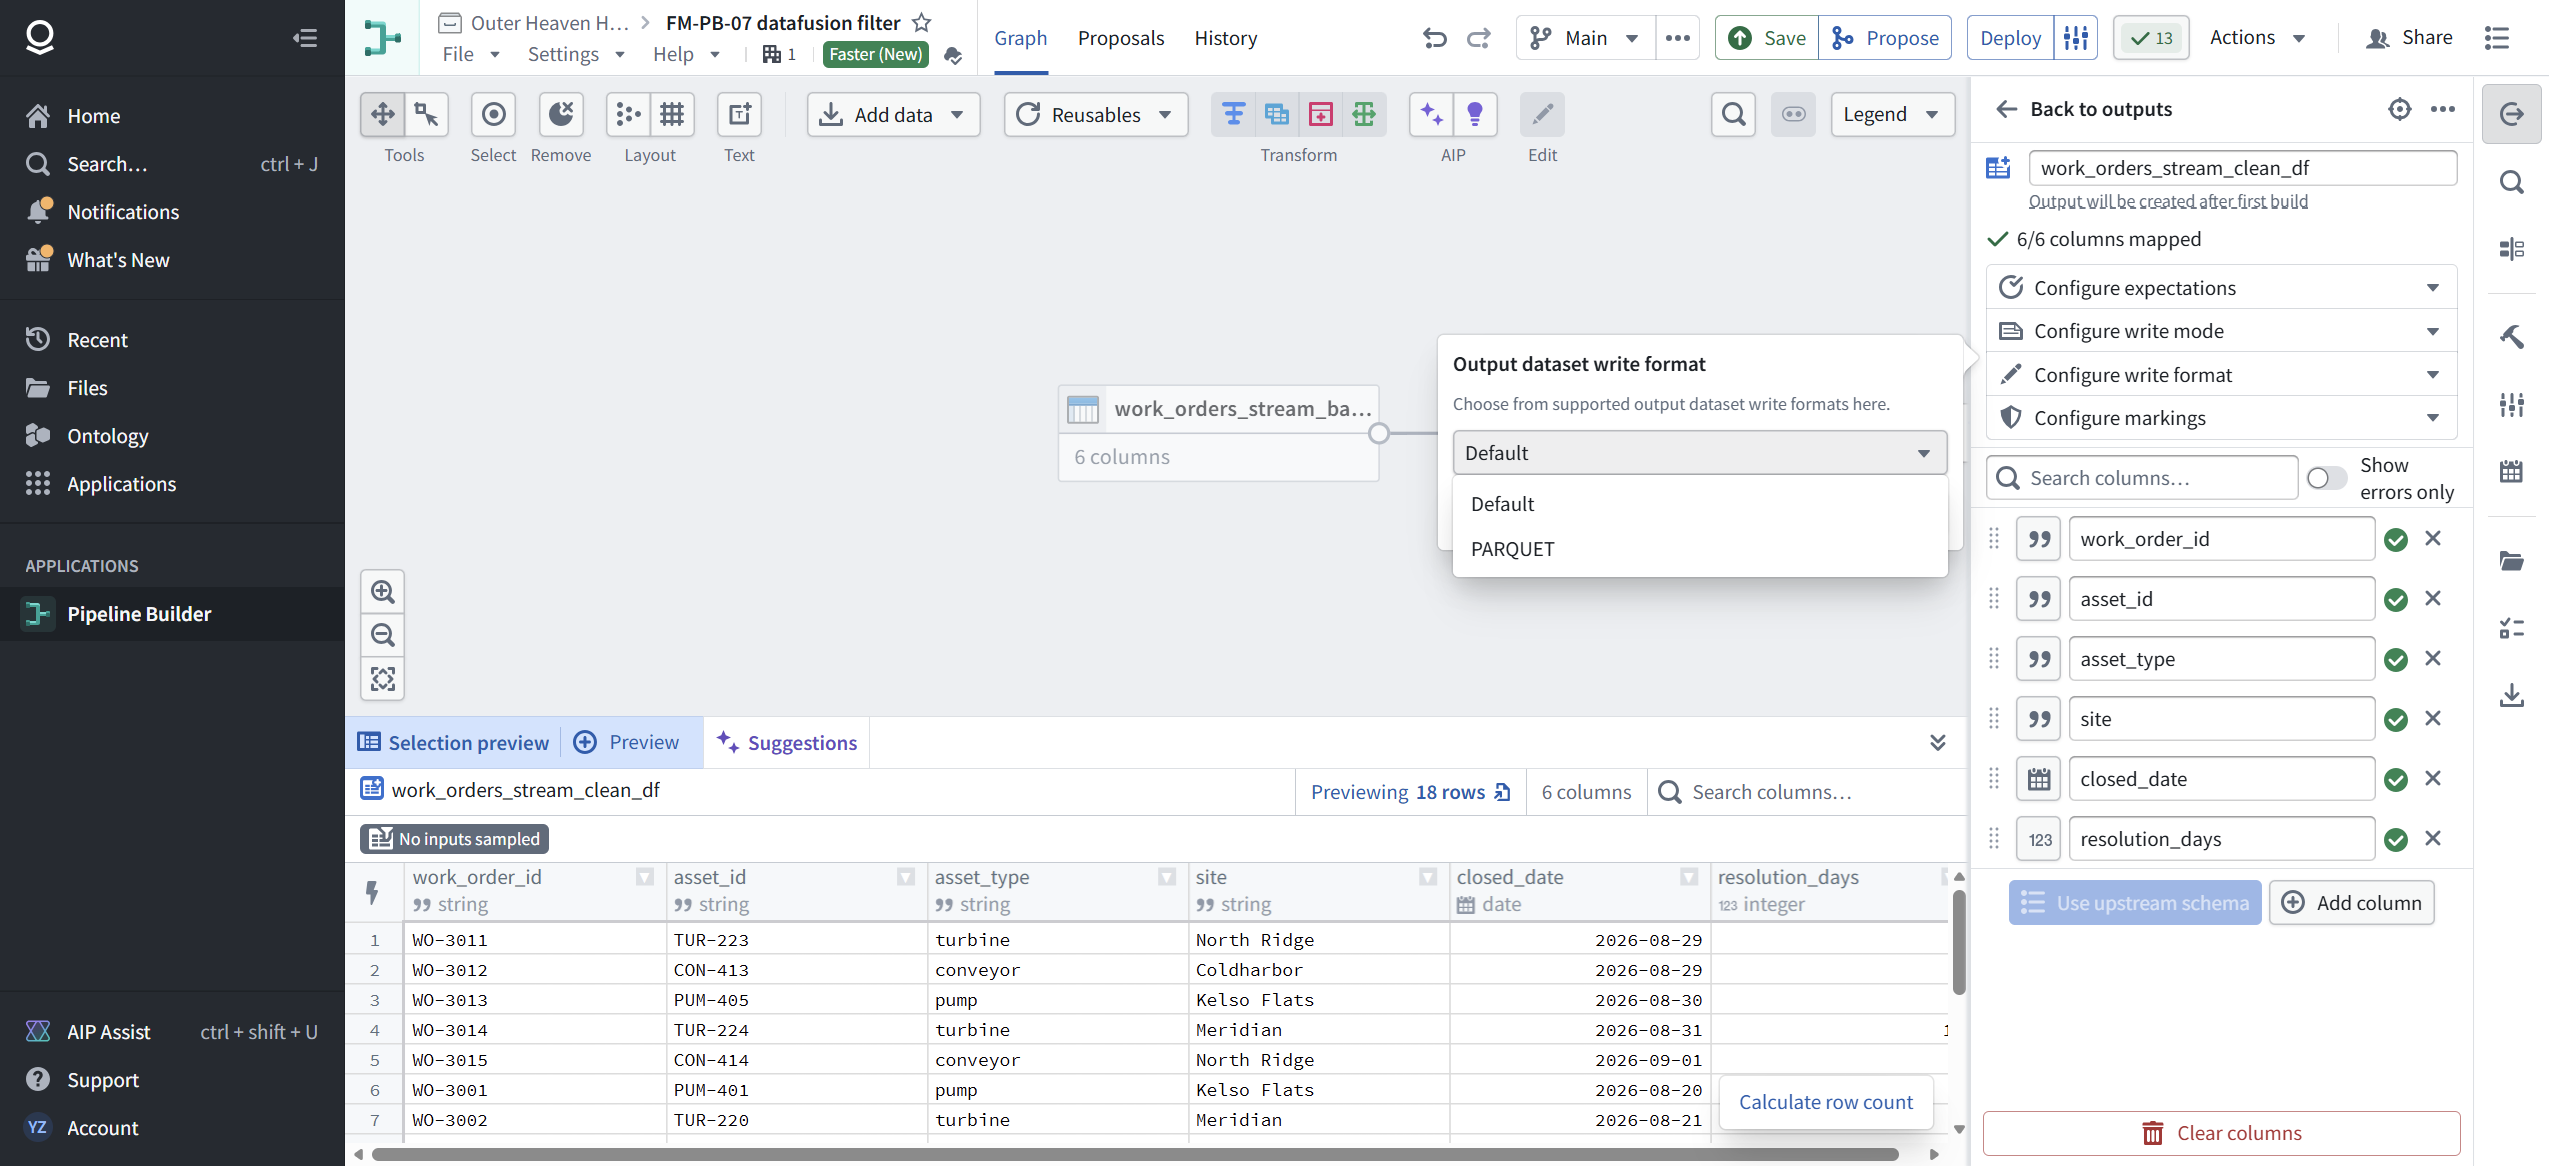
Two findings in one control. First, on Faster the output format list is that short. Second, and this is the one to remember: there is no partitioning control anywhere in Pipeline Builder's output panel. If a review ever asks you how a Pipeline Builder output is partitioned, the honest answer is that the tool does not ask you. Partitioning decisions live elsewhere (code transforms, or the platform's defaults), and anyone who needs explicit control is already in FM-PB-06 territory.
Open Edit output settings too. Ours defaulted to the project folder and the enrollment ontology, but the panel is where you would catch a wrong one before the build writes data to it.

Field repair FR-2: if you are unsure where an output will land, check Edit output settings before deploying. The first build writes wherever that panel says, and "I never saw a dialog" is not a defense.
[ STEP 5: THE COMPUTE PROFILE IS A DEPLOY-TIME DIAL ]
Click Deploy. The panel does three things: shows the last deployment, lists which outputs will build (all logic updates on deploy, but only checked outputs build), and exposes the Compute profile. Ours read Default, Small, with a Configure button.
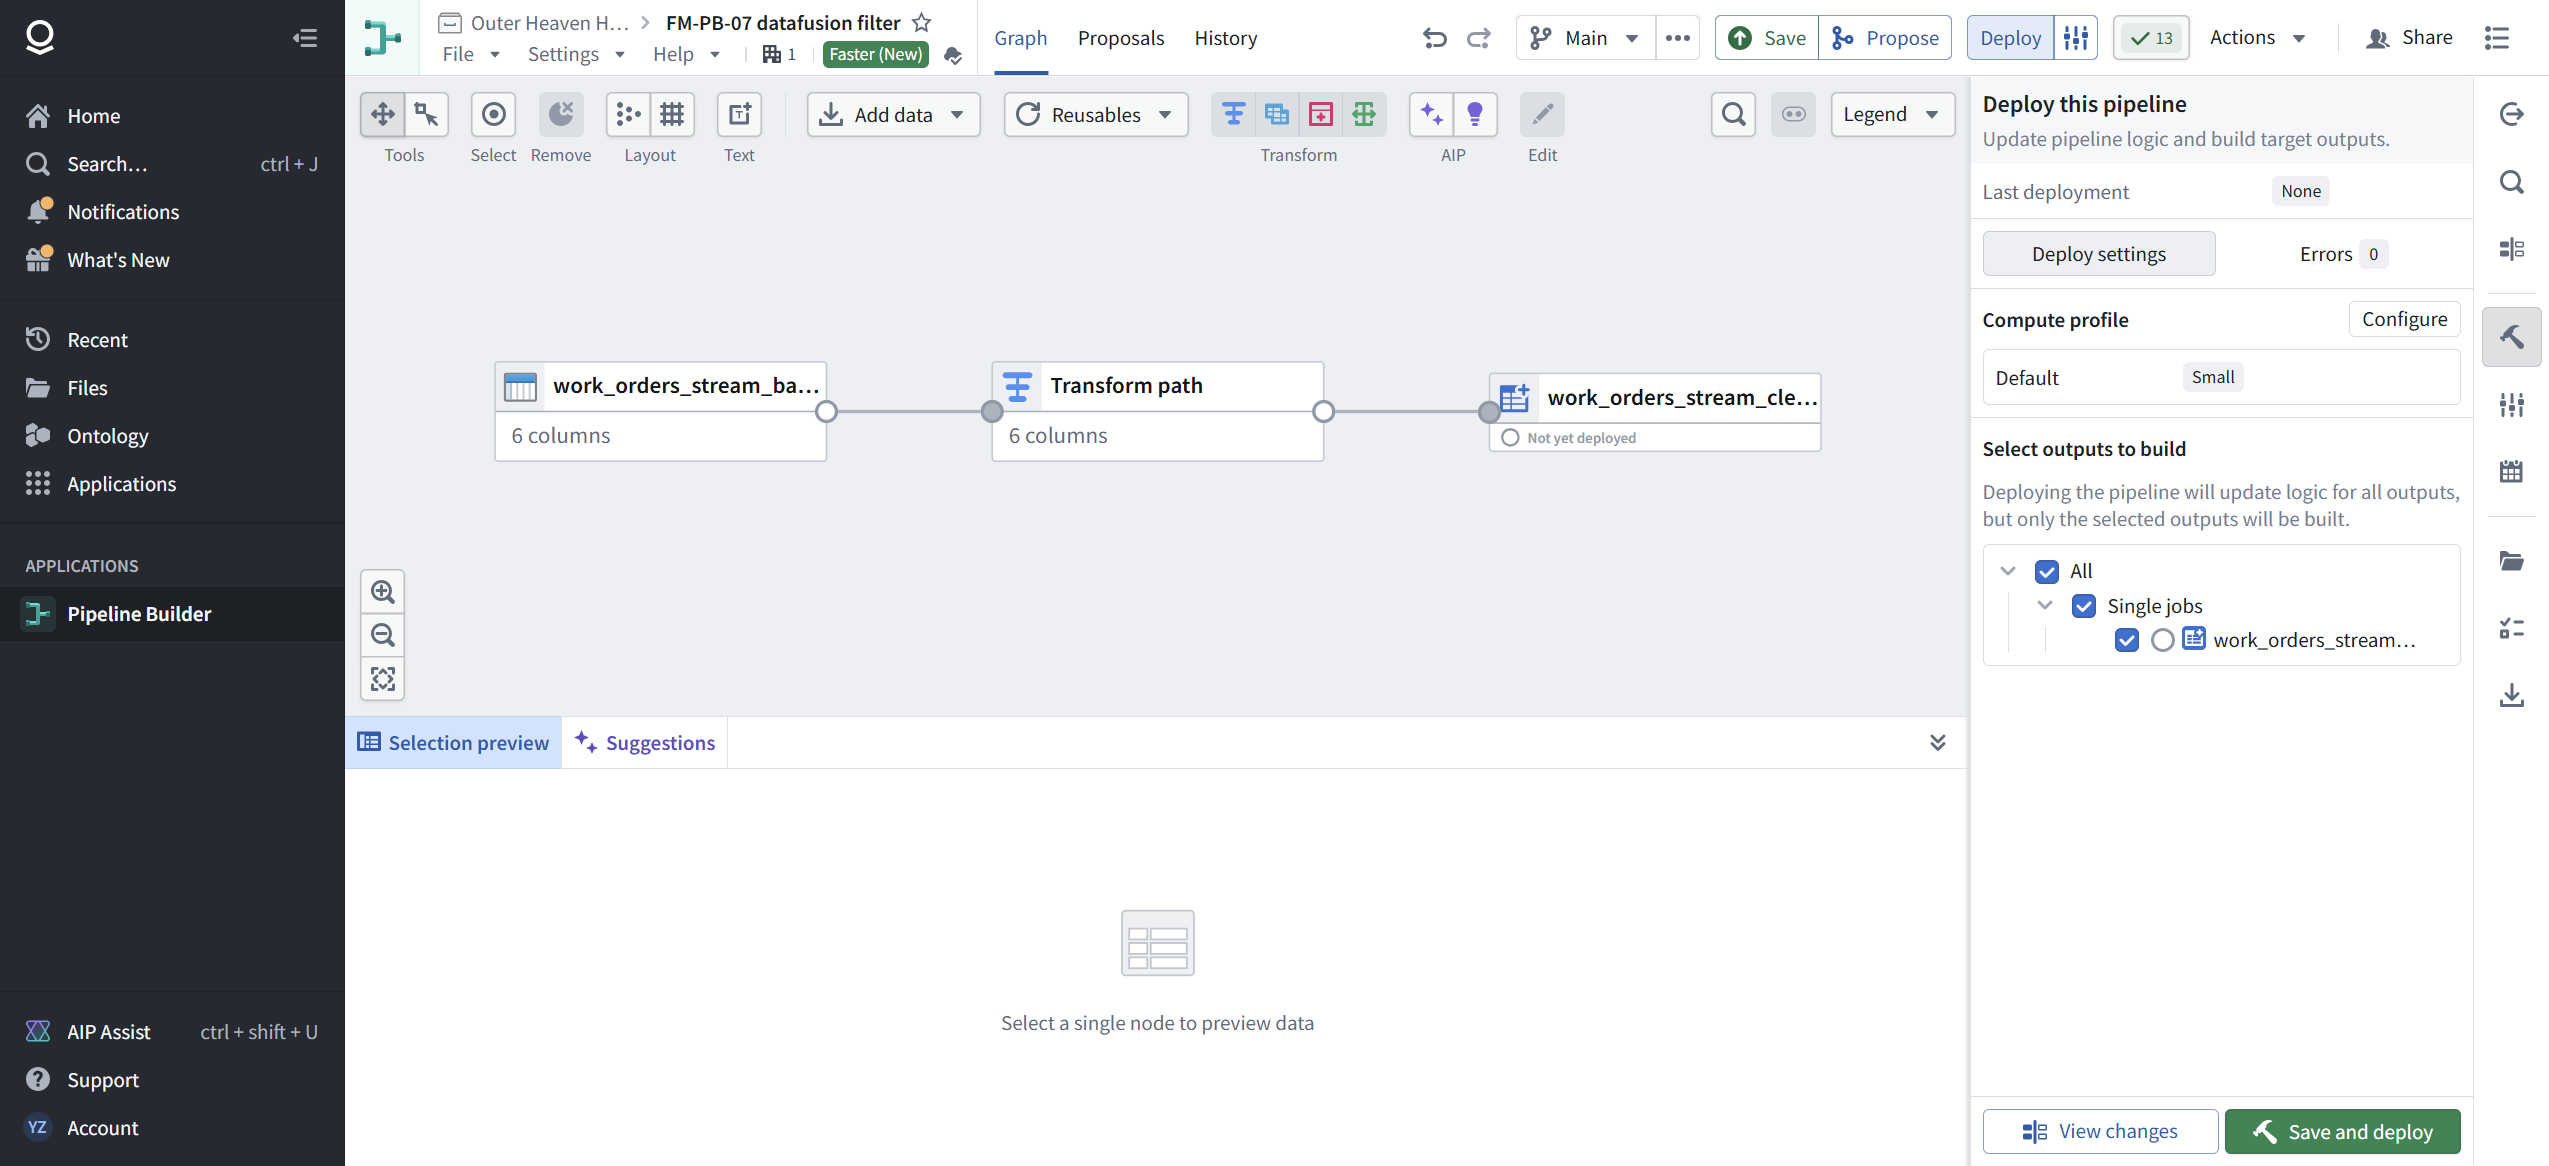
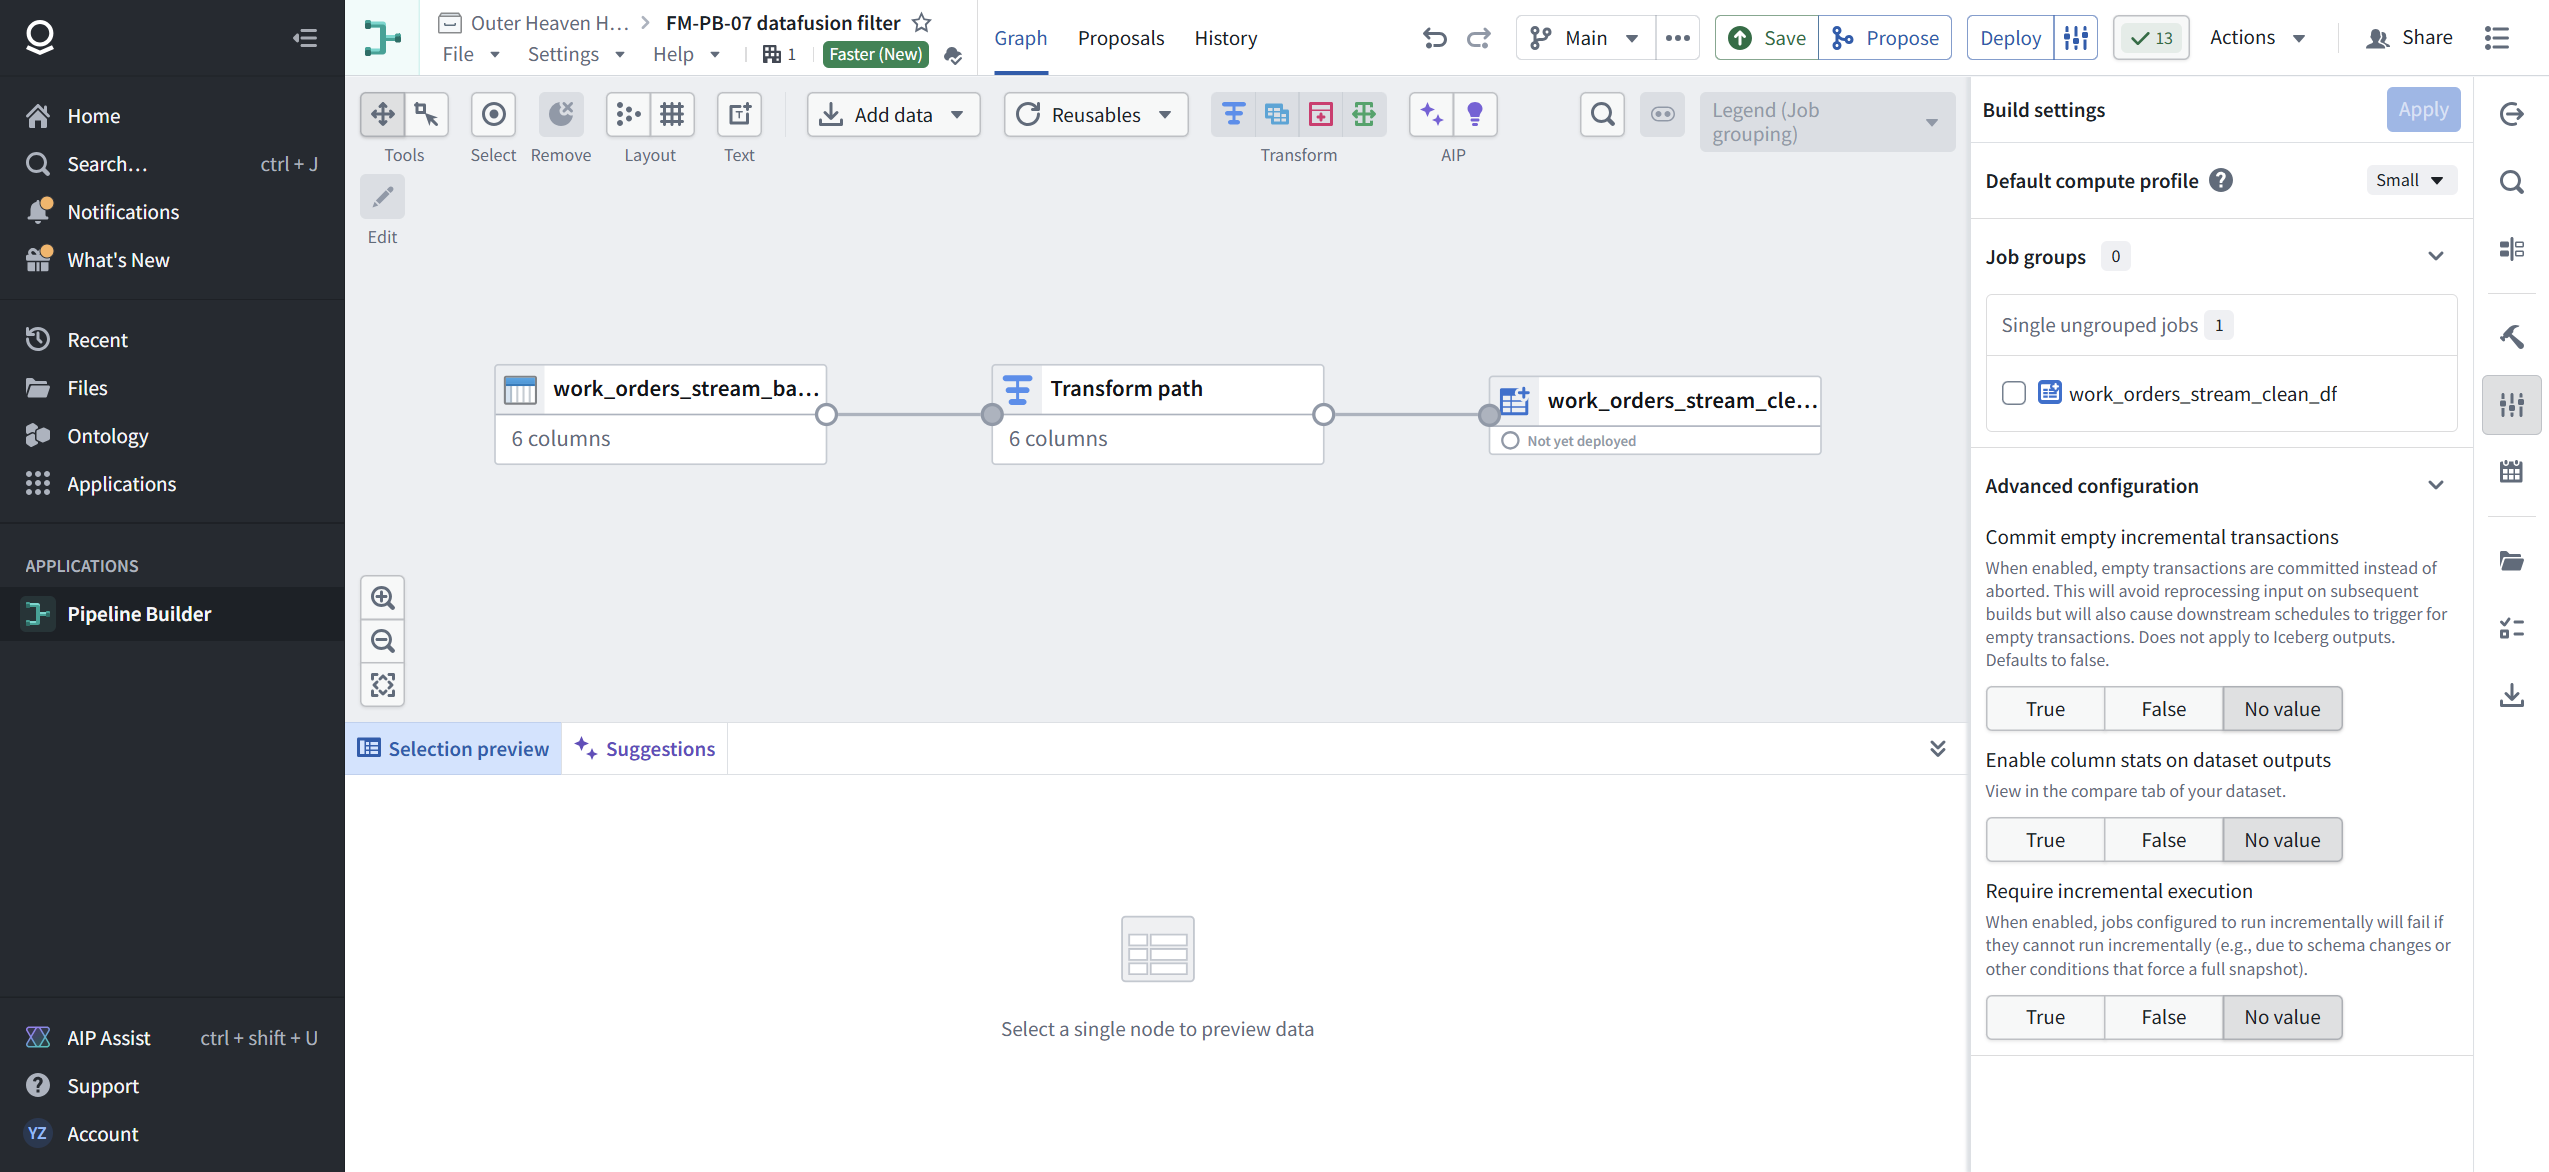
Configure opens Build settings. The compute profile popover, verbatim: "Compute profiles that run using DataFusion. Larger compute profiles can reduce build times but may incur additional cost. Standard and Faster pipelines define compute profile sizes differently."

Expand Specifications on Small: Cores 1, Memory 7.5G. And a warning that matters for capacity planning: "These specifications may change between builds. Redeploy pipeline to apply changes."

The Profile size dropdown: Small, Medium, Large, Extra Large, Extra Extra Large.

Read the Small spec against what you know about the job. Nineteen rows. One core and 7.5 GB is not a constraint here; it is overkill. We kept Small. The discipline is not "always pick the smallest". The discipline is: look at the data, look at the dial, and only turn it when the meter says to. We will test whether bigger profiles move this job in a later module; it is on the not-tested list, not in this module's claims.
The same Build settings panel holds three advanced switches worth knowing exist: Commit empty incremental transactions (defaults false), Enable column stats on dataset outputs, and Require incremental execution, which makes jobs fail loudly when they cannot run incrementally instead of silently snapshotting.
[ STEP 6: DEPLOY AND TIME IT ]
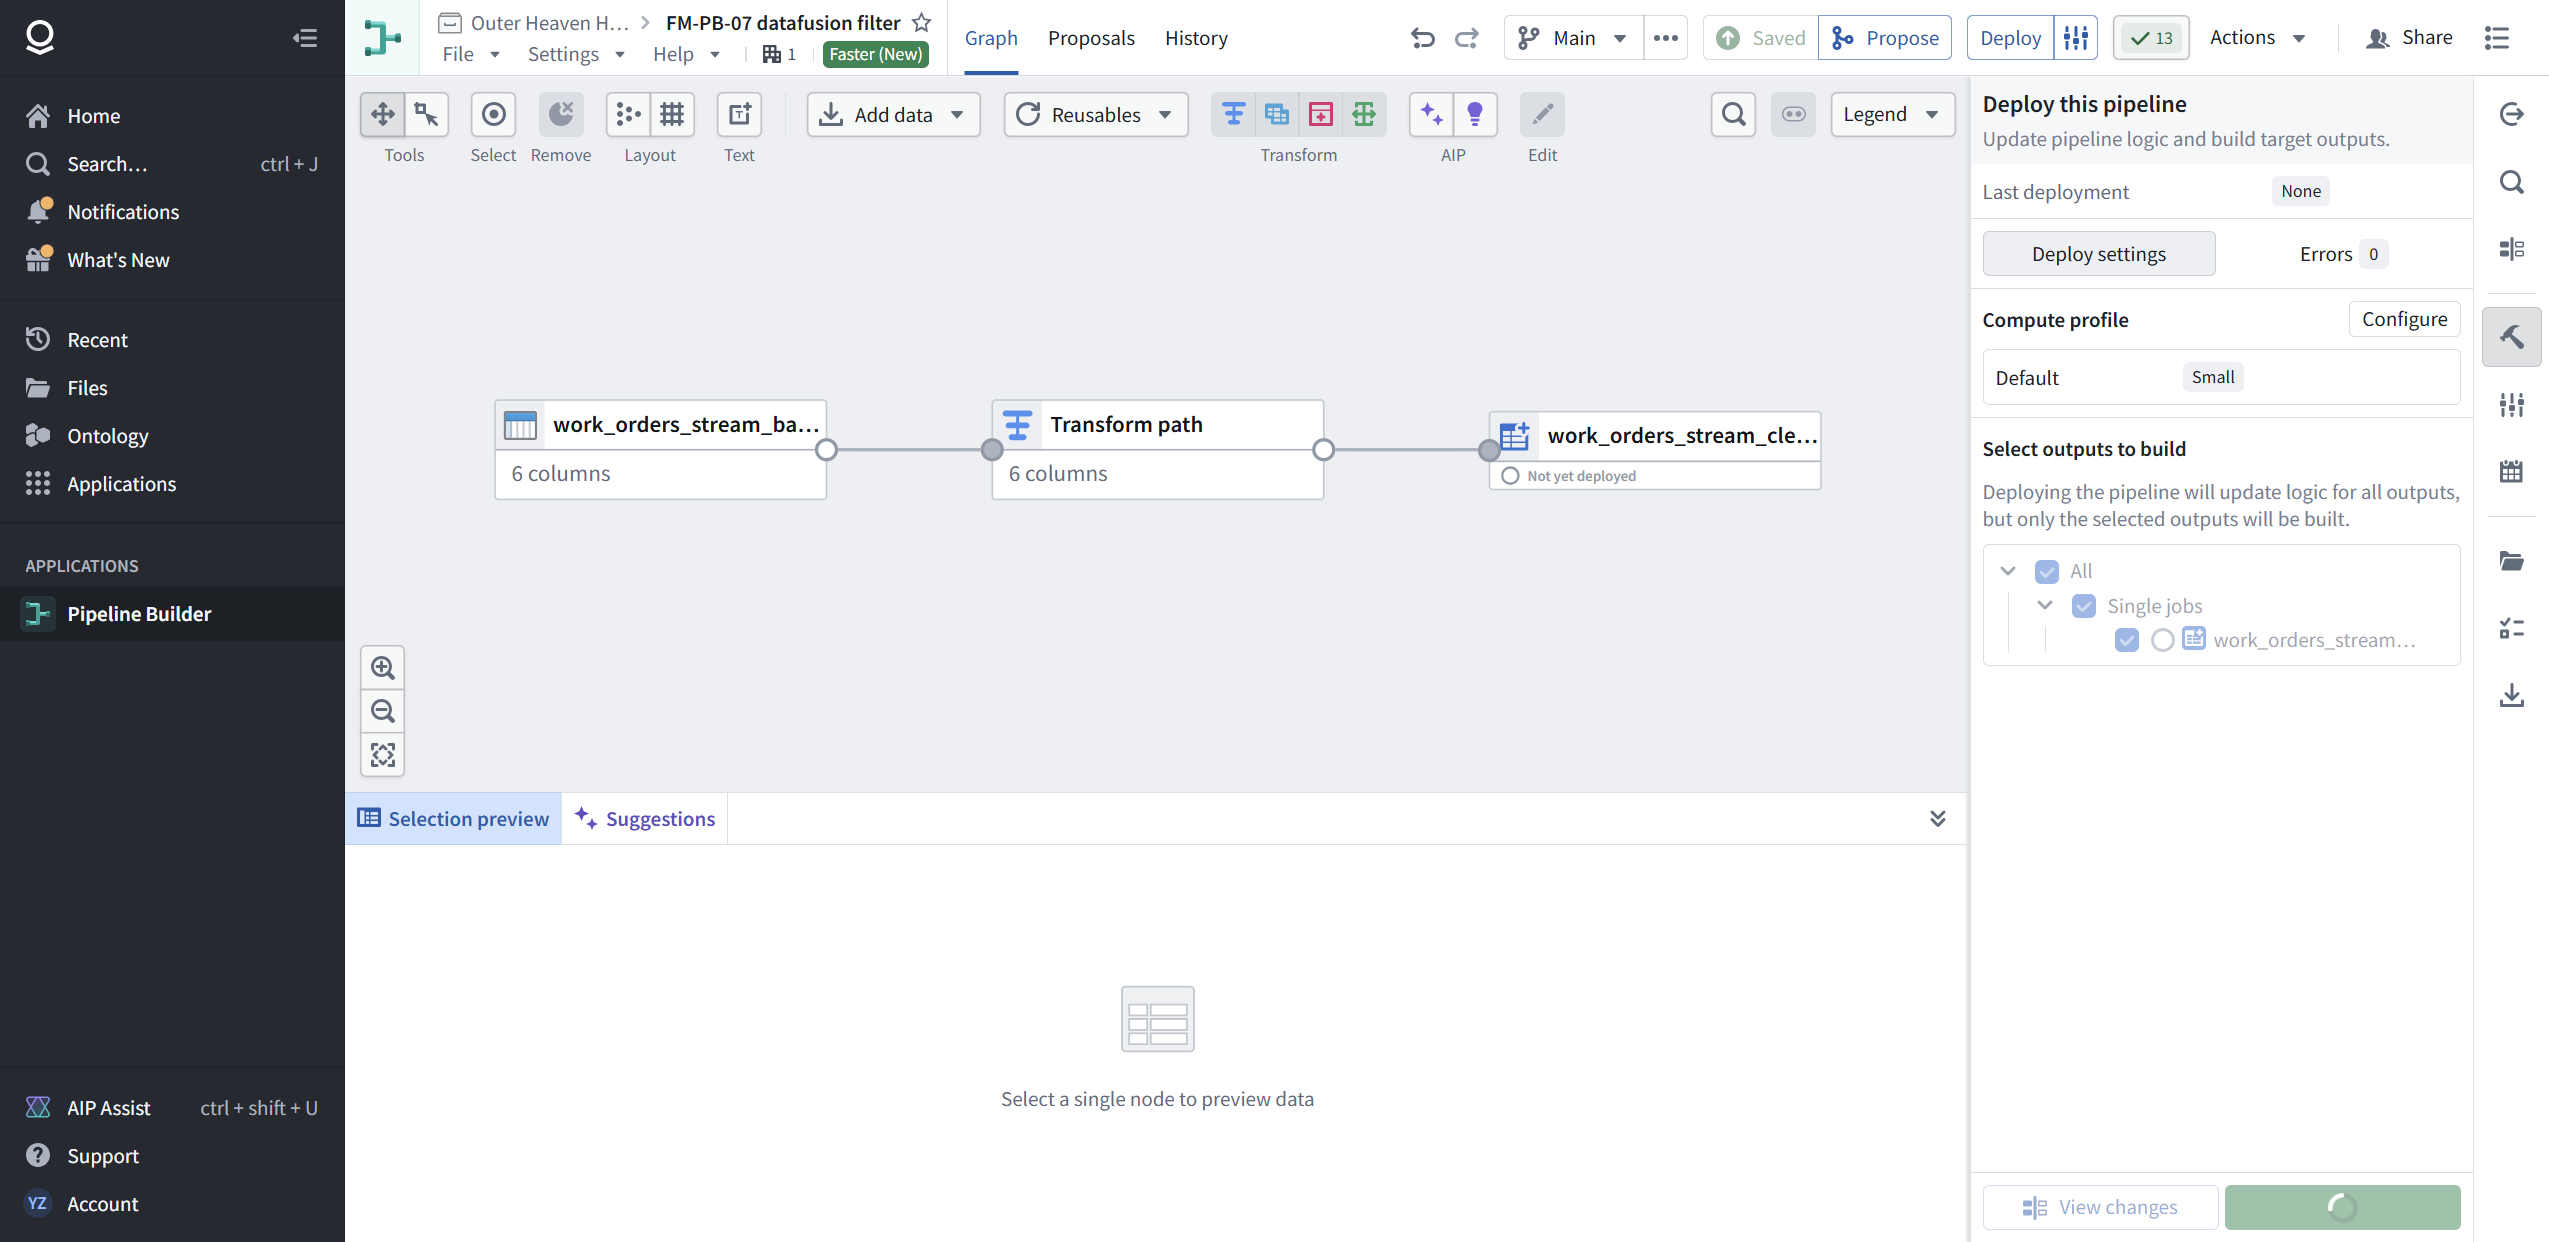
Save and deploy. Clicked at 18:22:58 UTC. The output node flipped to "Deployed and built" and the panel reported Last deployment: Succeeded inside the same minute. Under ninety seconds from click to green, including our screenshot latency.
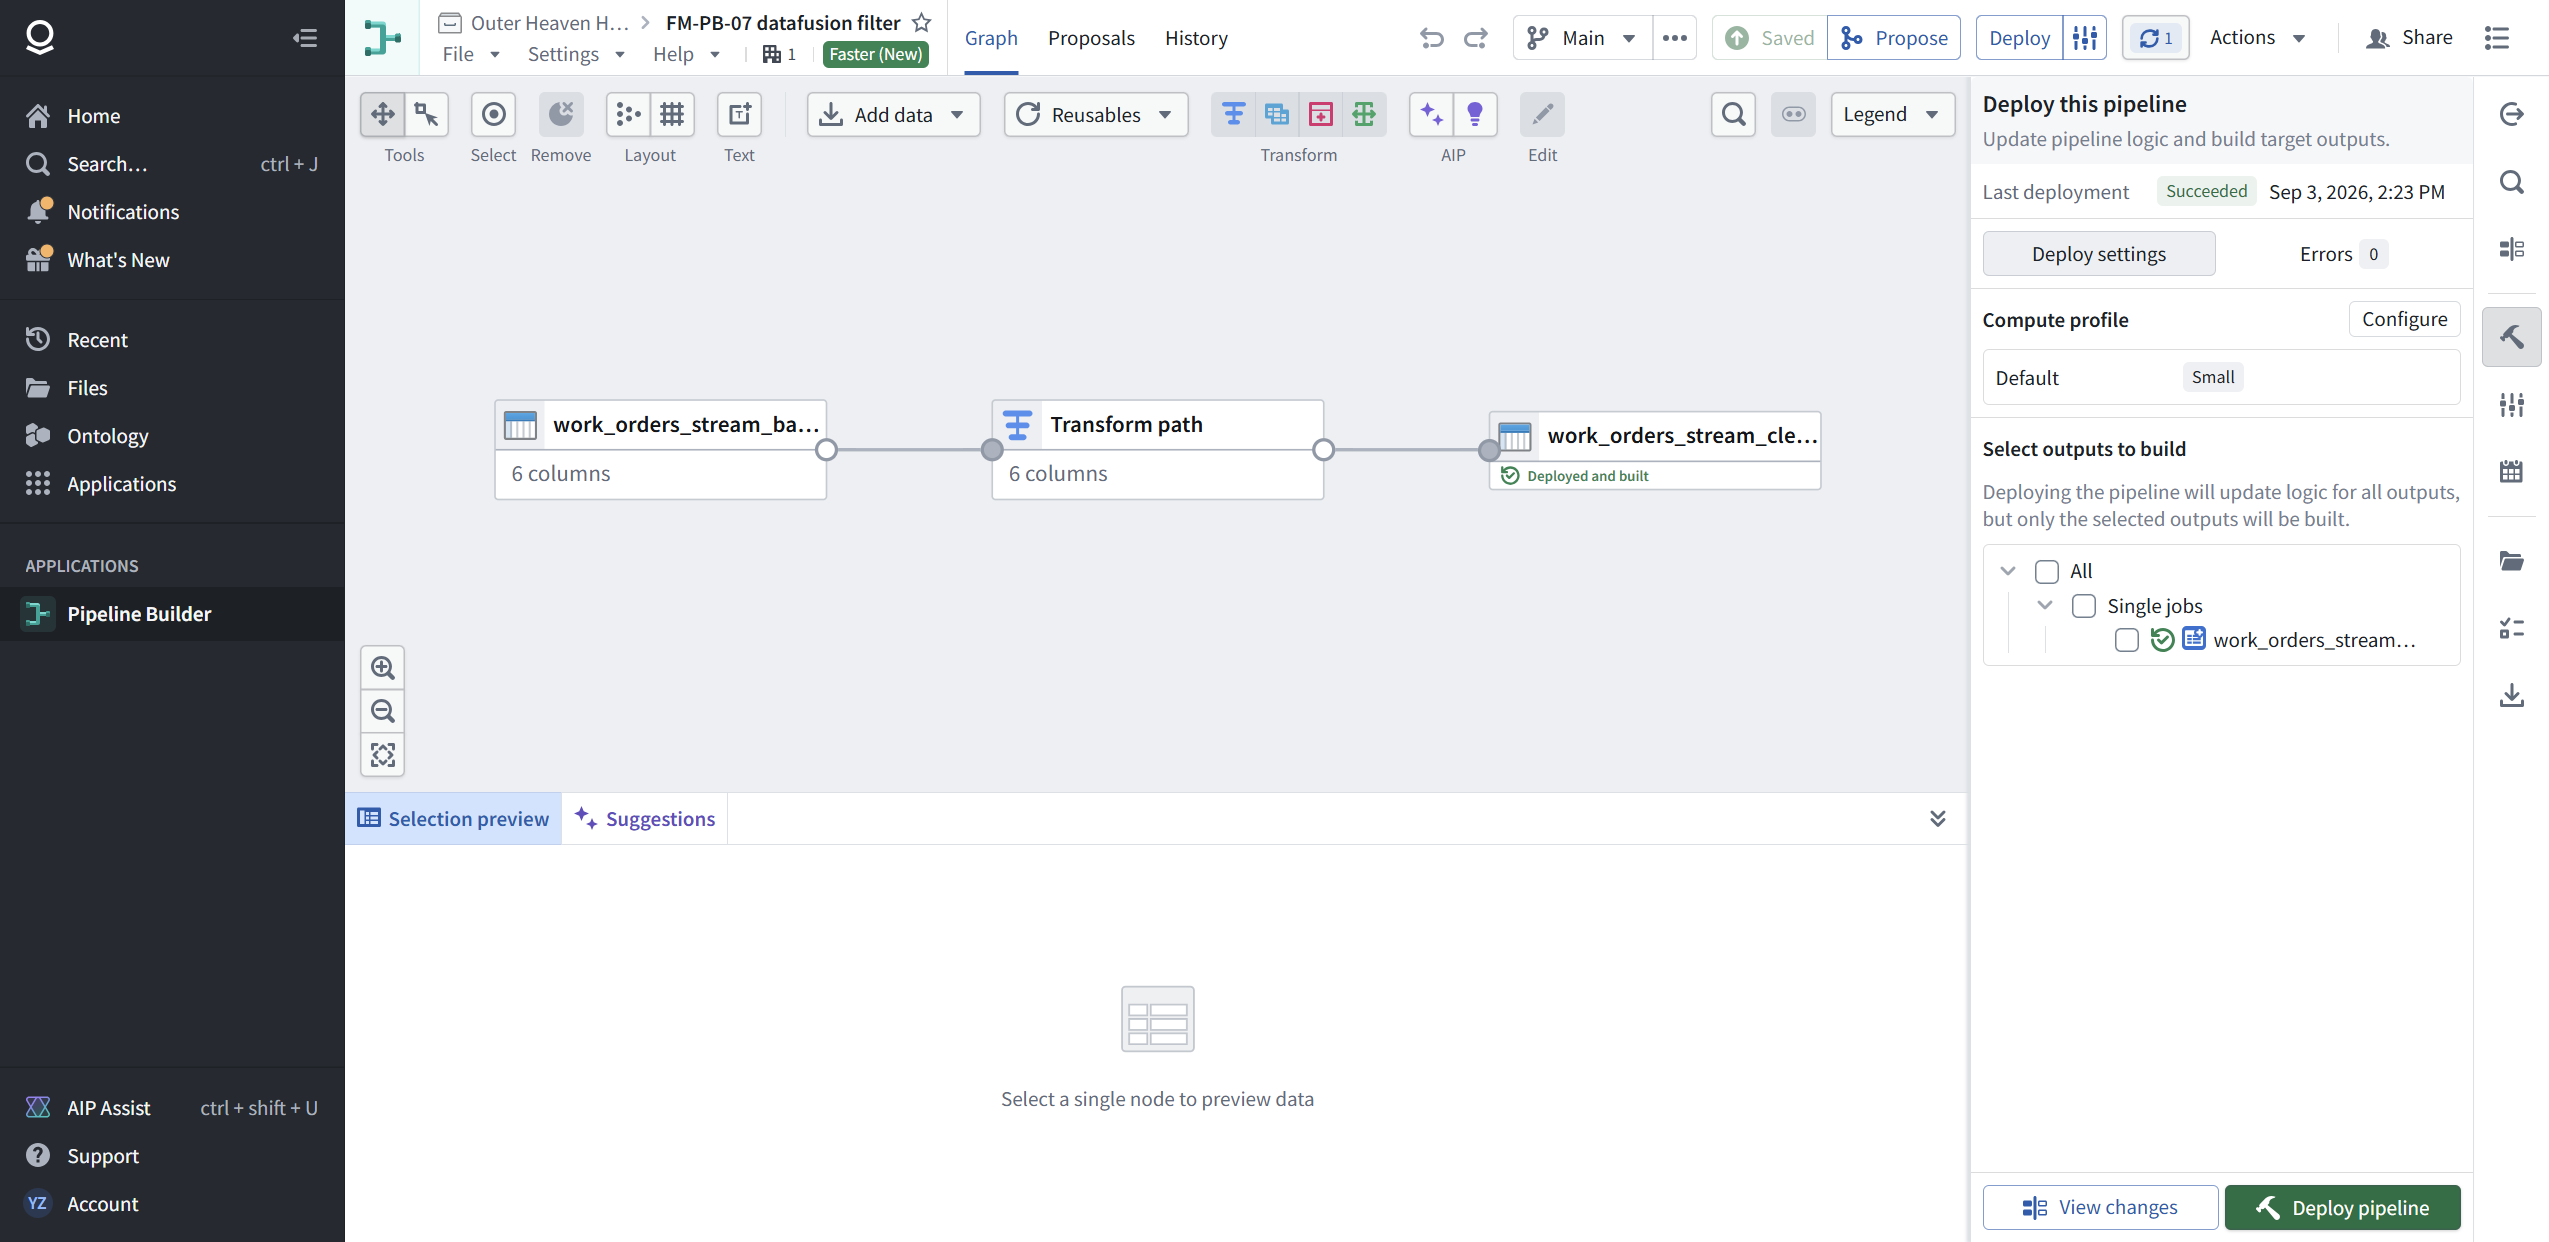
Open the output. work_orders_stream_clean_df: 18 rows, 6 columns, 3 files, 6.5 KB, Updated via "FM-PB-07 datafusion filter". WO-3017, the negative resolution_days trap row, is absent. The DataFusion path enforced the predicate exactly like Spark and polars did.

[ STEP 7: READ THE BUILD REPORT LIKE A BILL ]
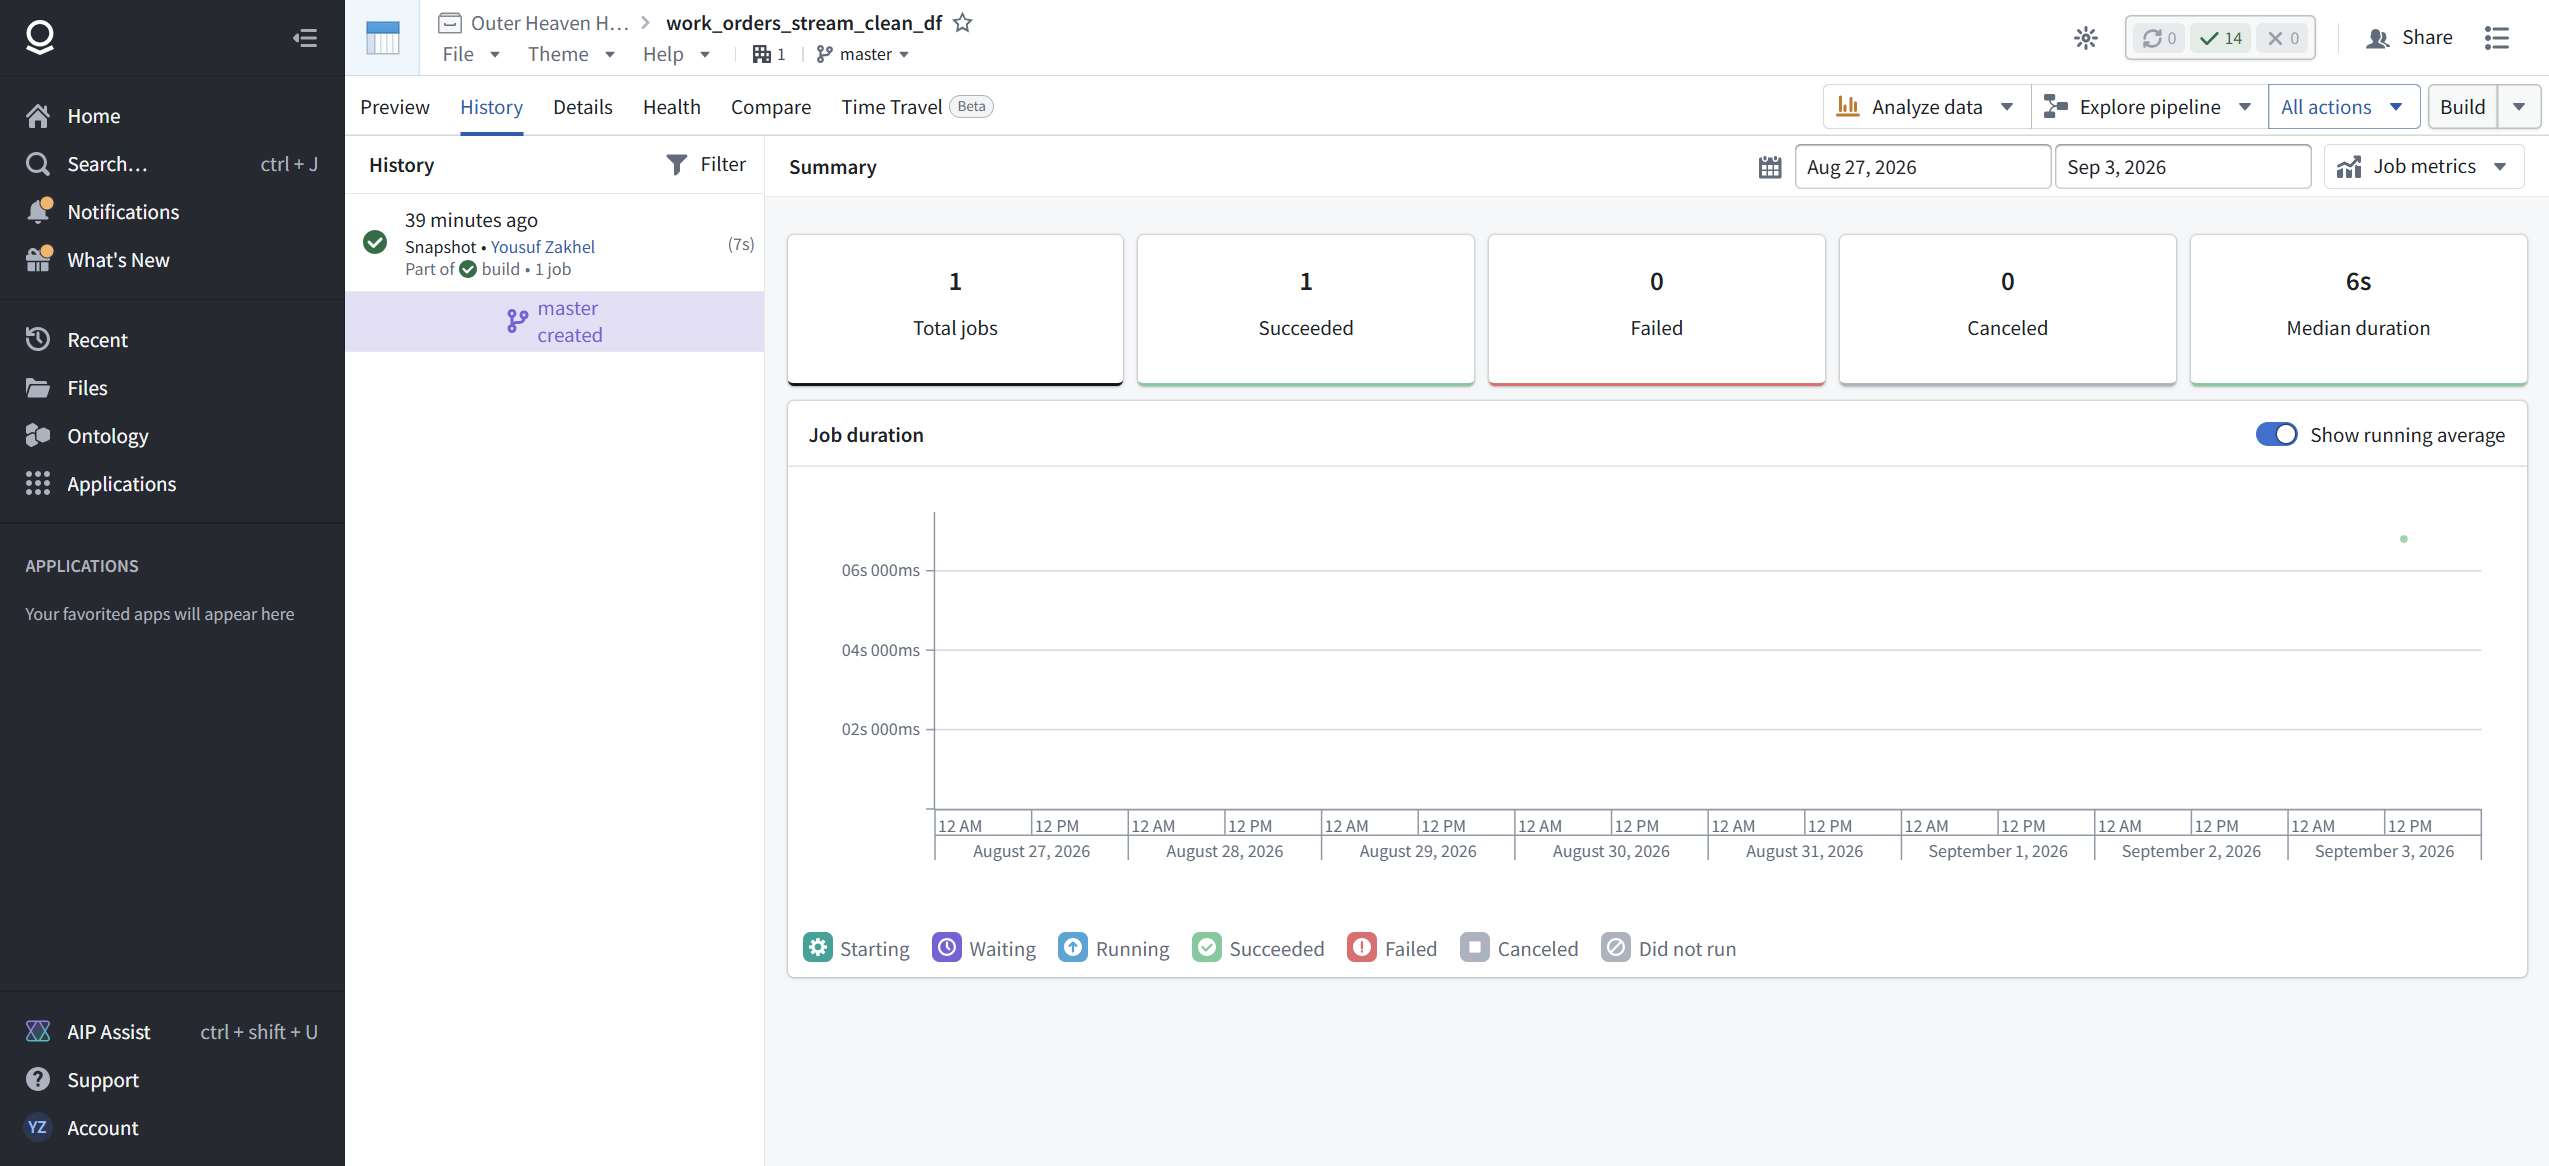
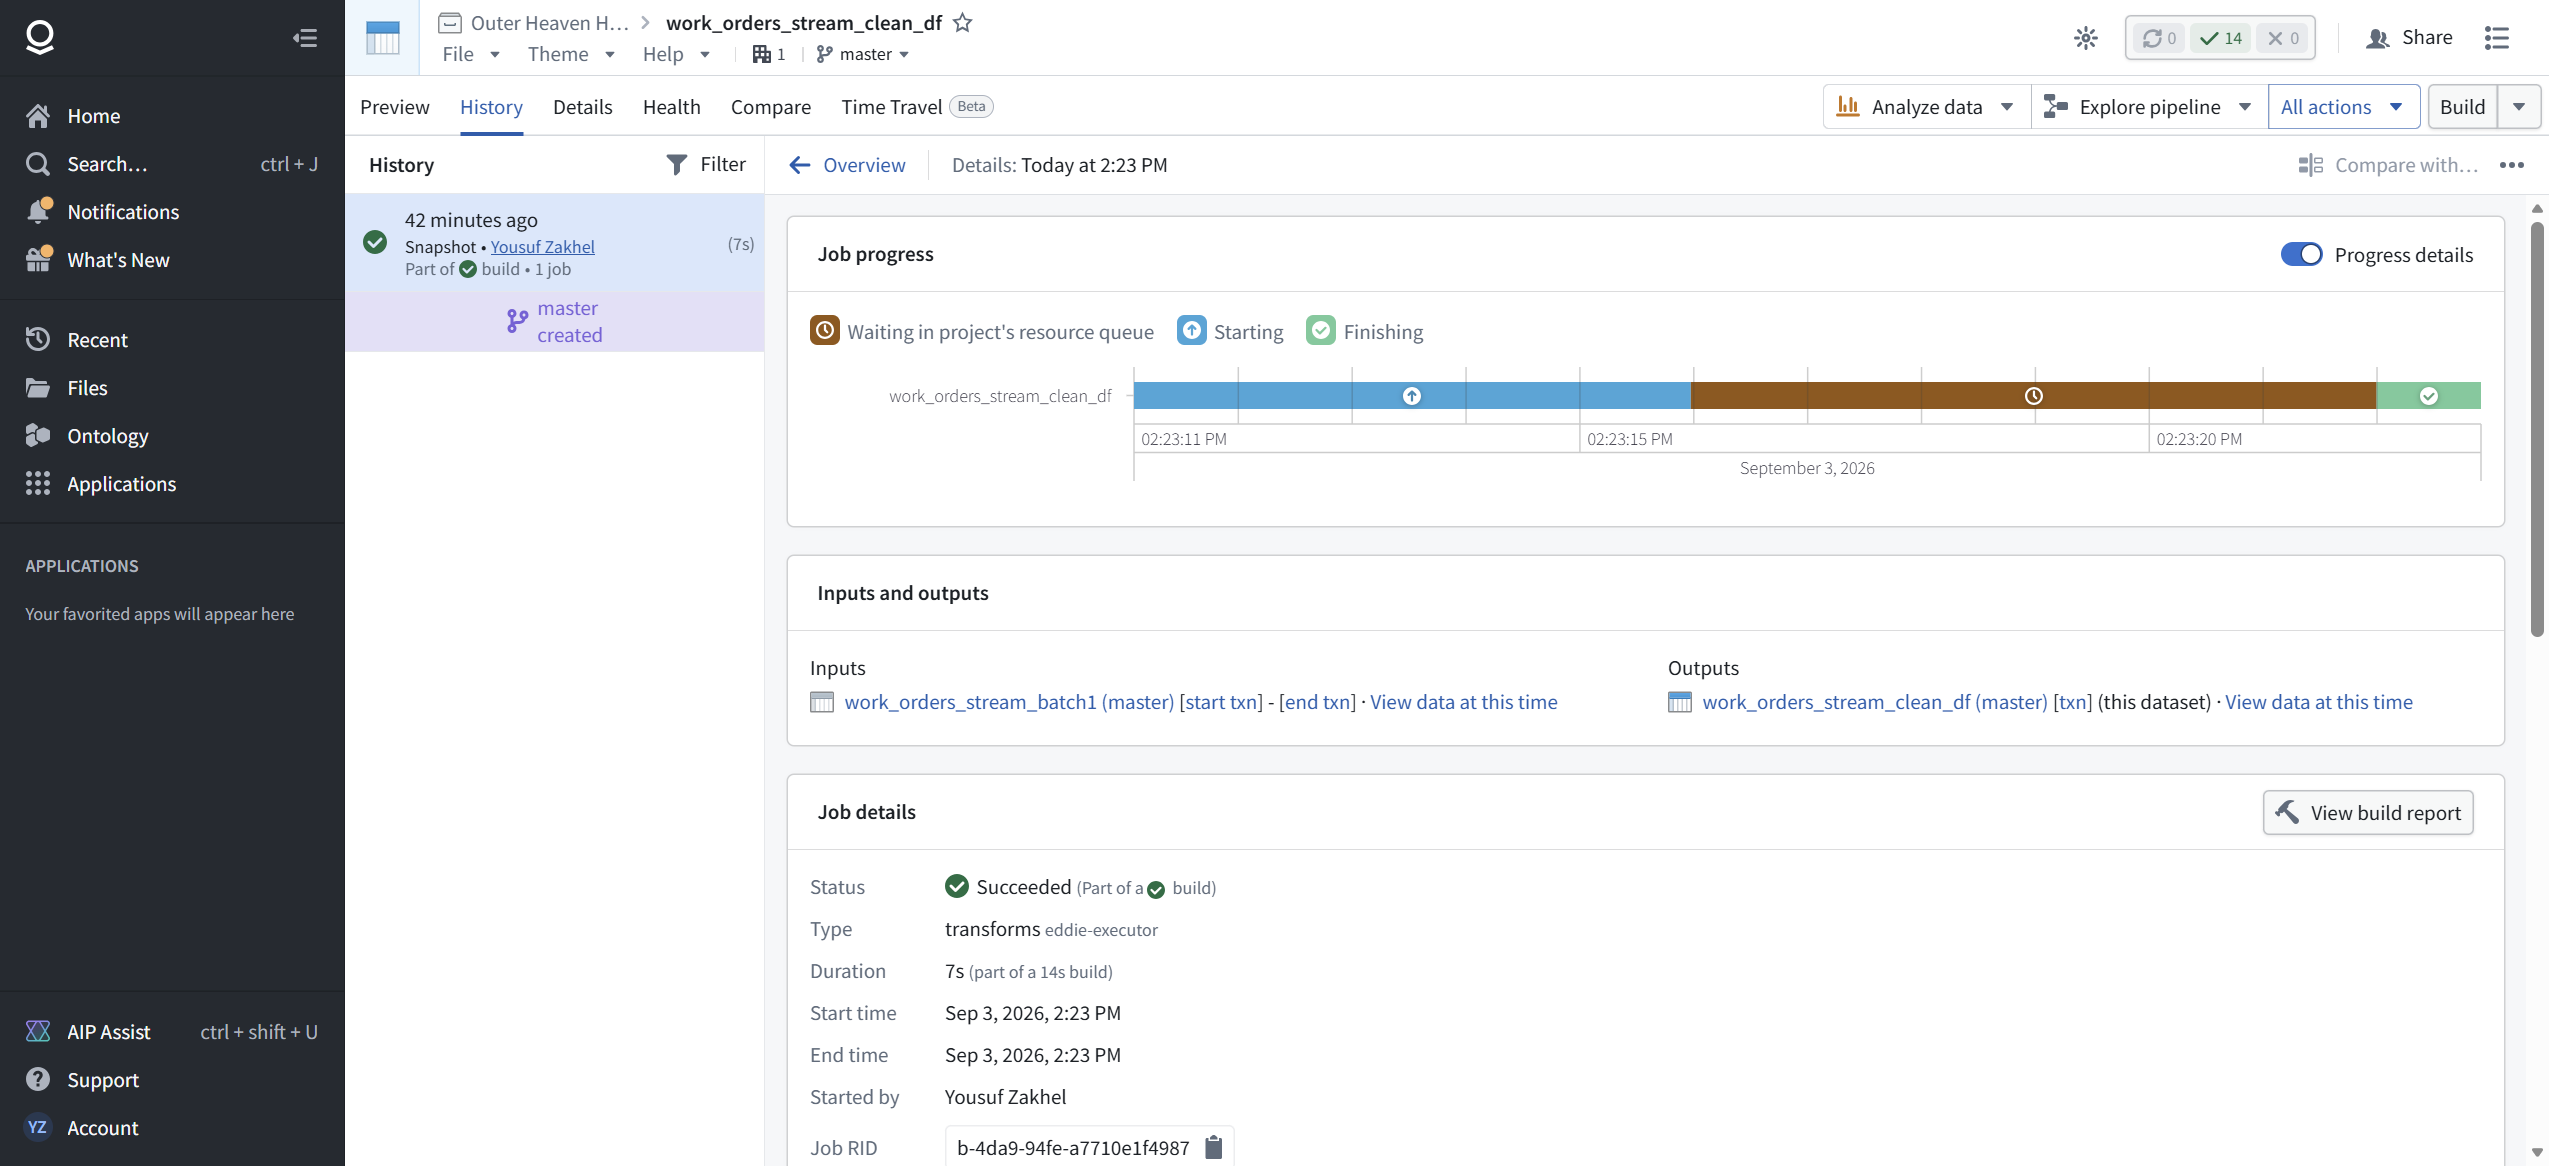
History shows one Snapshot transaction and a Median duration of 6s. The transaction detail says Duration 7s, "part of a 14s build", job type transforms eddie-executor. The build report's own Build info panel says Duration 13s, Estimated 6s. Two surfaces disagree by a second on both numbers; we report both as displayed rather than picking a favorite.
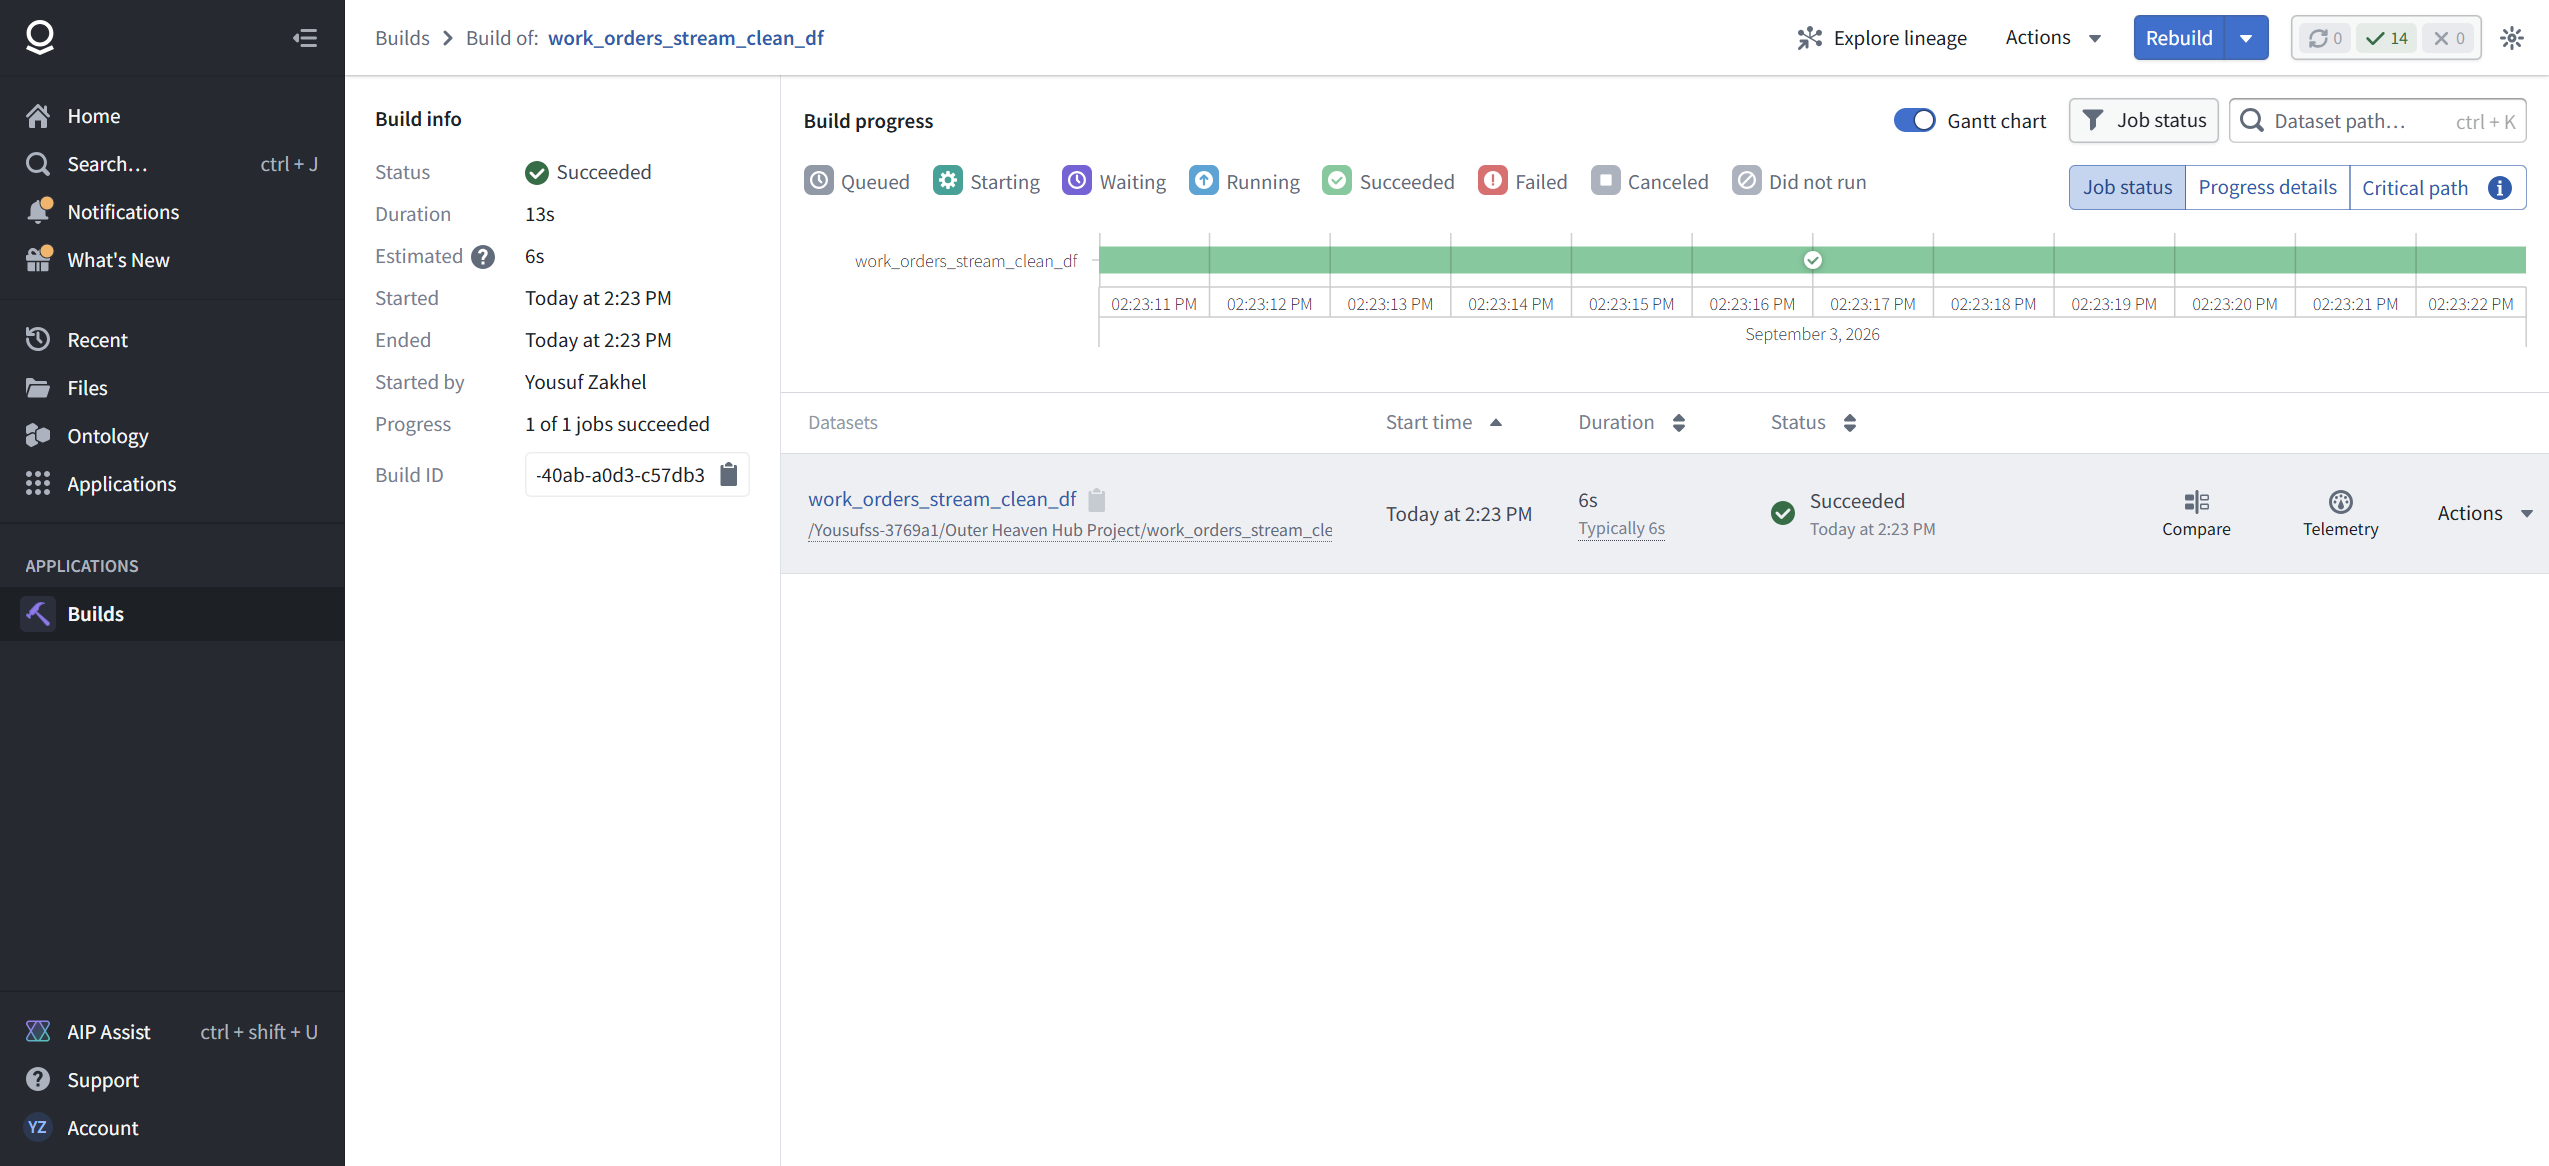
The build report's stage list is where the module's point lives:
- Started job, 2:23:11 PM (4s)
- Waited in project's resource queue, 2:23:15 PM (6s)
- Succeeded, 2:23:21 PM

Four seconds to start, six seconds waiting for a slot in the project's resource queue, and the actual DataFusion compute is the sliver at the end. On a 19-row job the platform's control plane costs more than the query. This is the general law of small builds, and it held on all three engines: Spark's 40 to 52 seconds was almost all cluster startup, polars spent most of its 20 seconds initializing, and DataFusion got the compute down to seconds but still paid the queue. Scaling the data grows the compute sliver. The queue does not care how many rows you have.
[ STEP 8: KNOW WHAT THE METER DOES NOT SHOW YOU HERE ]
Open Telemetry on the job. On our FM-PB-06 lightweight job this panel had twelve resource metrics with live graphs. On this DataFusion job it has two tabs, Job status and Logs. Job status says "Job succeeded". Logs says "No logs found in the given time range" for the entire run window.
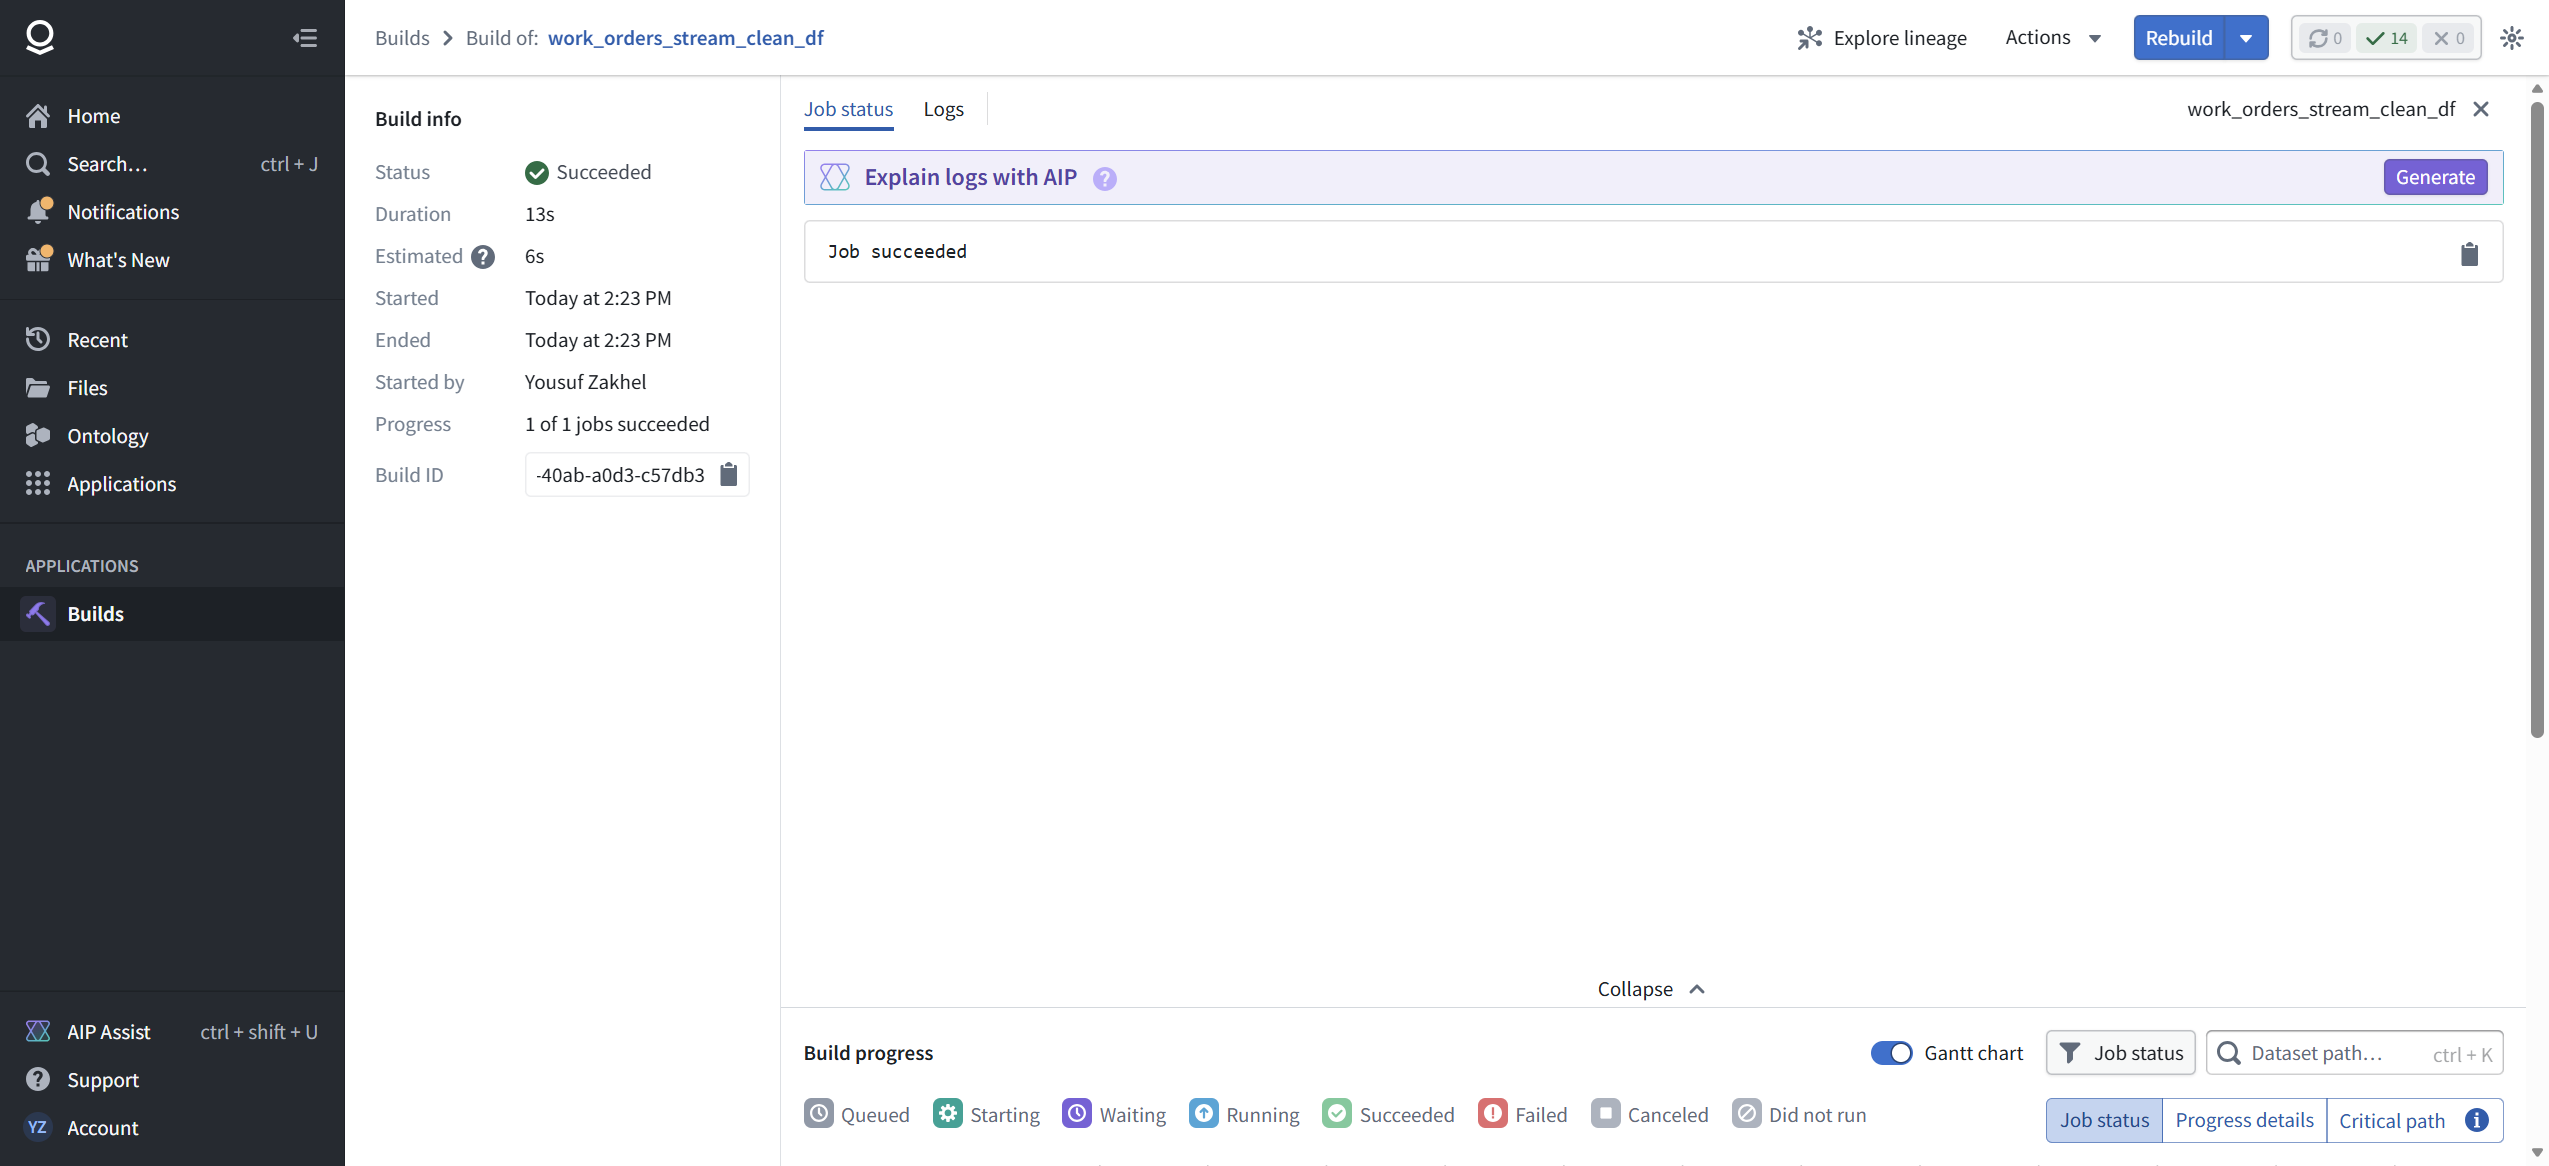

Field repair FR-3: if you open Telemetry on a Faster job looking for CPU graphs and find only "Job succeeded" and an empty Logs tab, nothing is broken. That is the current surface. For cost reading on Faster jobs you have the History summary (median duration), the build report stages, and the Job metrics duration charts (the dropdown also offers sync metrics for Lime, Phonograph, and Postgres). Plan your instrumentation accordingly: if you need per-job resource curves on DataFusion builds, do not promise them from this panel.
One thing the panel does offer: an "Explain logs with AIP" banner with a Generate button. We did not exercise it here because there were no logs to explain. On a failing job with real log output, that banner is the first thing to try, and a later module will take it apart.
[ FIELD REPAIRS ]
FR-1: You added a dataset output and got an unnamed "New dataset" node with a timestamp and no save dialog. That is the design. Rename it in the right panel's name input, then Save. The dataset is born on the first build, not at configuration time.
FR-2: You are not sure where the output will be written. Edit output settings on the output card before deploying. Verify folder and ontology there; the build writes whatever that panel says.
FR-3: Telemetry on a Faster/DataFusion job shows no Metrics tab and empty logs. Expected. Use History median duration and the build report stage timings as the meter for these jobs.
[ FAQ ]
Which engine should my pipeline use?
For board-expressible batch transforms on ordinary data, Faster is the default we would reach for after this session: same output contract, a fraction of the wall time, fewer moving parts than a Spark cluster. Stay on Standard when you need what Faster's matrix excludes (Use LLM, Media sets, full geospatial). Go to code when the logic stops being a board. The matrix at creation time is the contract; read it before you commit a pipeline family to an engine.
Does a bigger compute profile make my build faster?
The popover itself only promises that larger profiles "can" reduce build time and "may incur additional cost". On this 19-row job we did not test above Small, and we say so rather than guess. What the build report proves is that at small scale the queue and startup dominate, so more cores would have bought us almost nothing here.
Why does the build take 13 seconds when the job takes 6?
Because the build is more than the job. Starting the job (4s) and waiting in the project's resource queue (6s) are billed to your wall clock before the engine reads a single row. Small builds are mostly overhead on every engine we tested.
Can I control partitioning or file format from Pipeline Builder?
Format, barely: Default or PARQUET on Faster. Partitioning, not at all from this UI. If partitioning is a requirement, that requirement is telling you the pipeline belongs in code.
What did you not test?
Medium and larger compute profiles and whether they move this job. The PARQUET write format versus Default. Expectations, alternate write modes, and markings on the output. The three advanced build switches. "Explain logs with AIP" on a job with real logs. Scheduling. Enrollment-level usage metering, which we could not locate in this enrollment's navigation.
[ NET POSITION ]
Compute in Foundry is not a mystery tax; it is a set of decisions the UI exposes if you know where to look. The engine is chosen when the pipeline is created, with a feature matrix that tells you exactly what you are giving up. The size is chosen at deploy time, with cores and memory spelled out and a warning that changes need a redeploy. And the cost is readable after every run: History gives you the trend, the transaction gives you the phases, and the build report names the queue wait that dominates small jobs. Three engines ran the same 19 rows in this lab and the wall times were 40-plus seconds, 20 seconds, and 6. The lesson is not that DataFusion wins. It is that you can now prove statements like that yourself, in your own enrollment, before you sign up to run ten thousand of these a night.