Data Health Checks Are Tripwires, Not Gates
We put two failing data health checks on a live 70-row output dataset and forced two builds to find out what checks actually do. The core finding: a failing check never stops a build, at either severity, because there is no severity that blocks. Checks observe and report. Enforcement is a separate opt-in: auto-issues route a failure into a triage queue with an owner, a measured body line, and your note text carried verbatim into the issue. Also verified live: checks live on the dataset page, not in Pipeline Builder; they do not evaluate retroactively; and the Numeric range editor cannot save a single bound of exactly 0.
- FM-PB-02 (a deployed output dataset; this module uses its work_orders_closed_repaired output)
- FM-PB-03 (Pipeline Builder vocabulary)
Field notes from the Avinyr lab. Everything below was observed live on 2026-08-31 and 2026-09-01 against the real FM-PB-02 output dataset (work_orders_closed_repaired, RID ri.foundry.main.dataset.f84f3a04-7f3c-4248-adaa-f36dd2dbd71e). The data is synthetic, built by the FM-PB-02 trap generator, and labeled as such. Every screenshot is ours.
[ READ THIS FIRST: WHAT THIS MODULE IS ]
The FM-PB-02 output deliberately contains 6 null resolution_days (8.57% of 70 rows) and 4 negative ones, down to -10. FM-PB-02 kept those rows visible on purpose and said the deciding was a business call. This module is where the decision gets instrumentation: we add checks that the data violates, run builds, and record what the platform actually does when checks fail.
The short version, verified twice: nothing stops. The build succeeds, the checks go red, and a counter in the dataset header turns red with them. Whether a human ever finds out is a second, separate configuration decision, and this module walks that decision to its end: an auto-created issue, assigned, with the evidence embedded.
[ WHAT YOU WILL HAVE AT THE END ]
One output dataset carrying two saved health checks: a Numeric range check on resolution_days (in between 0 and blank, Moderate) and a Null percentage check on resolution_days (at most 0%, Moderate). Both failing, by design, against synthetic trap data. One forced rebuild with both checks failing and the build green. One auto-created Issue, status Awaiting triage, priority Medium, assigned to a named human, with the check's note text inside it. And one verified doctrine you can repeat to your team: health checks are tripwires, not gates.
[ STEP 0: THE SPECIMEN ]
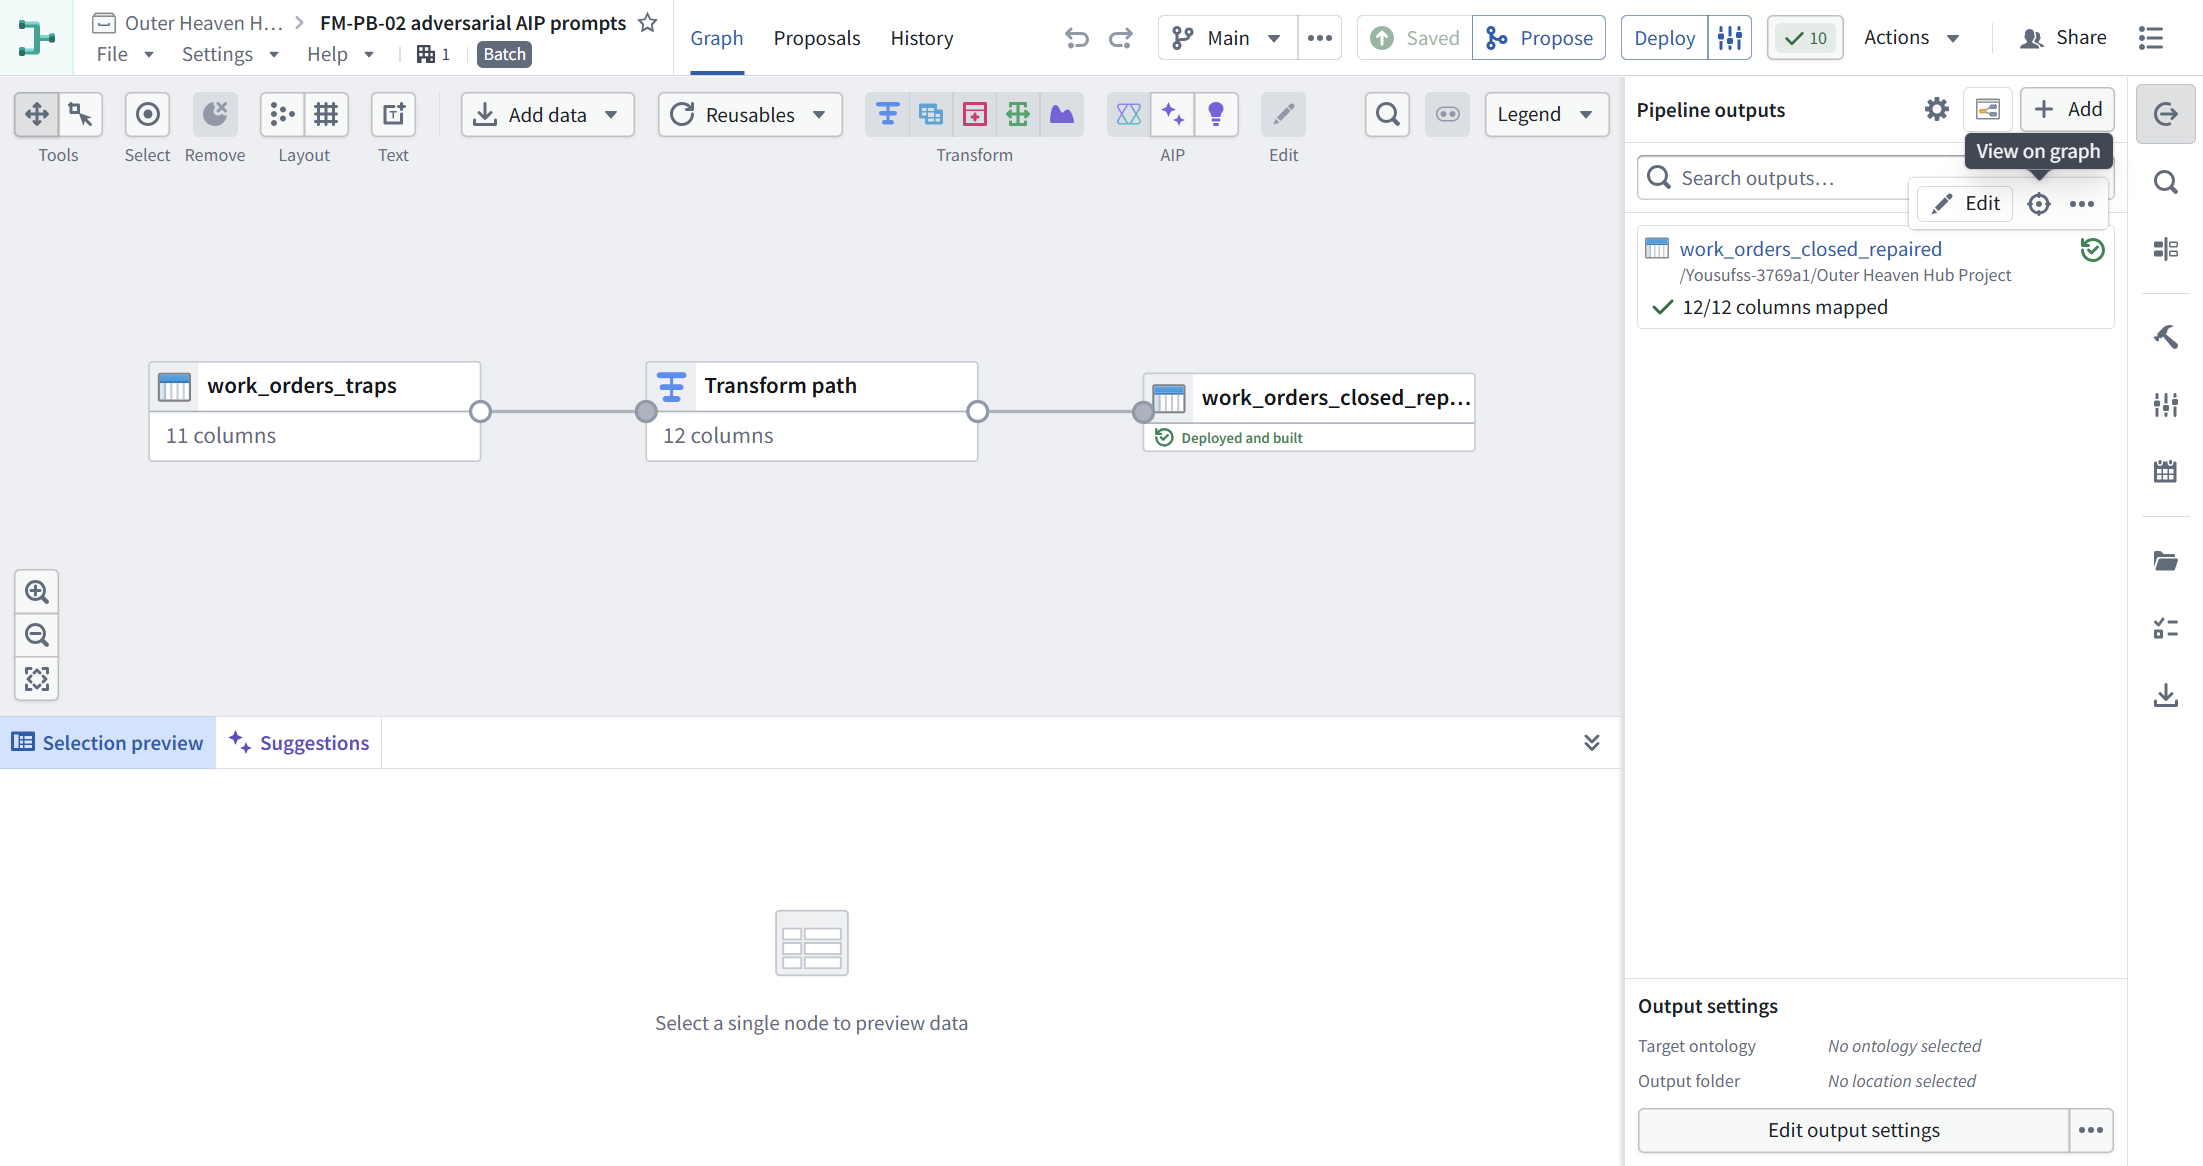
No new pipeline. The specimen is the deployed FM-PB-02 output: work_orders_closed_repaired, 70 rows, 12 columns, all synthetic. Known defects, computed before we opened Foundry: 6 rows with null resolution_days (WO-2007, WO-2019, WO-2086, WO-2093, WO-2094, WO-2110) and 4 rows with negative resolution_days (WO-2013 at -9, WO-2027 at -10, WO-2032 at -8, WO-2107 at -2).
[ STEP 1: THE CHECKS ARE NOT IN PIPELINE BUILDER ]
First finding, and it costs people time: Pipeline Builder has no expectations surface. Open the output node's "..." menu and you get Open, Actions, Rename, Overwrite, Delete. Nothing else. The graph shows no health badge on the node, then or later, even after two of its checks are failing.
Health checks live on the dataset page. Open the output dataset, go to the Health tab, click "+ Add checks".
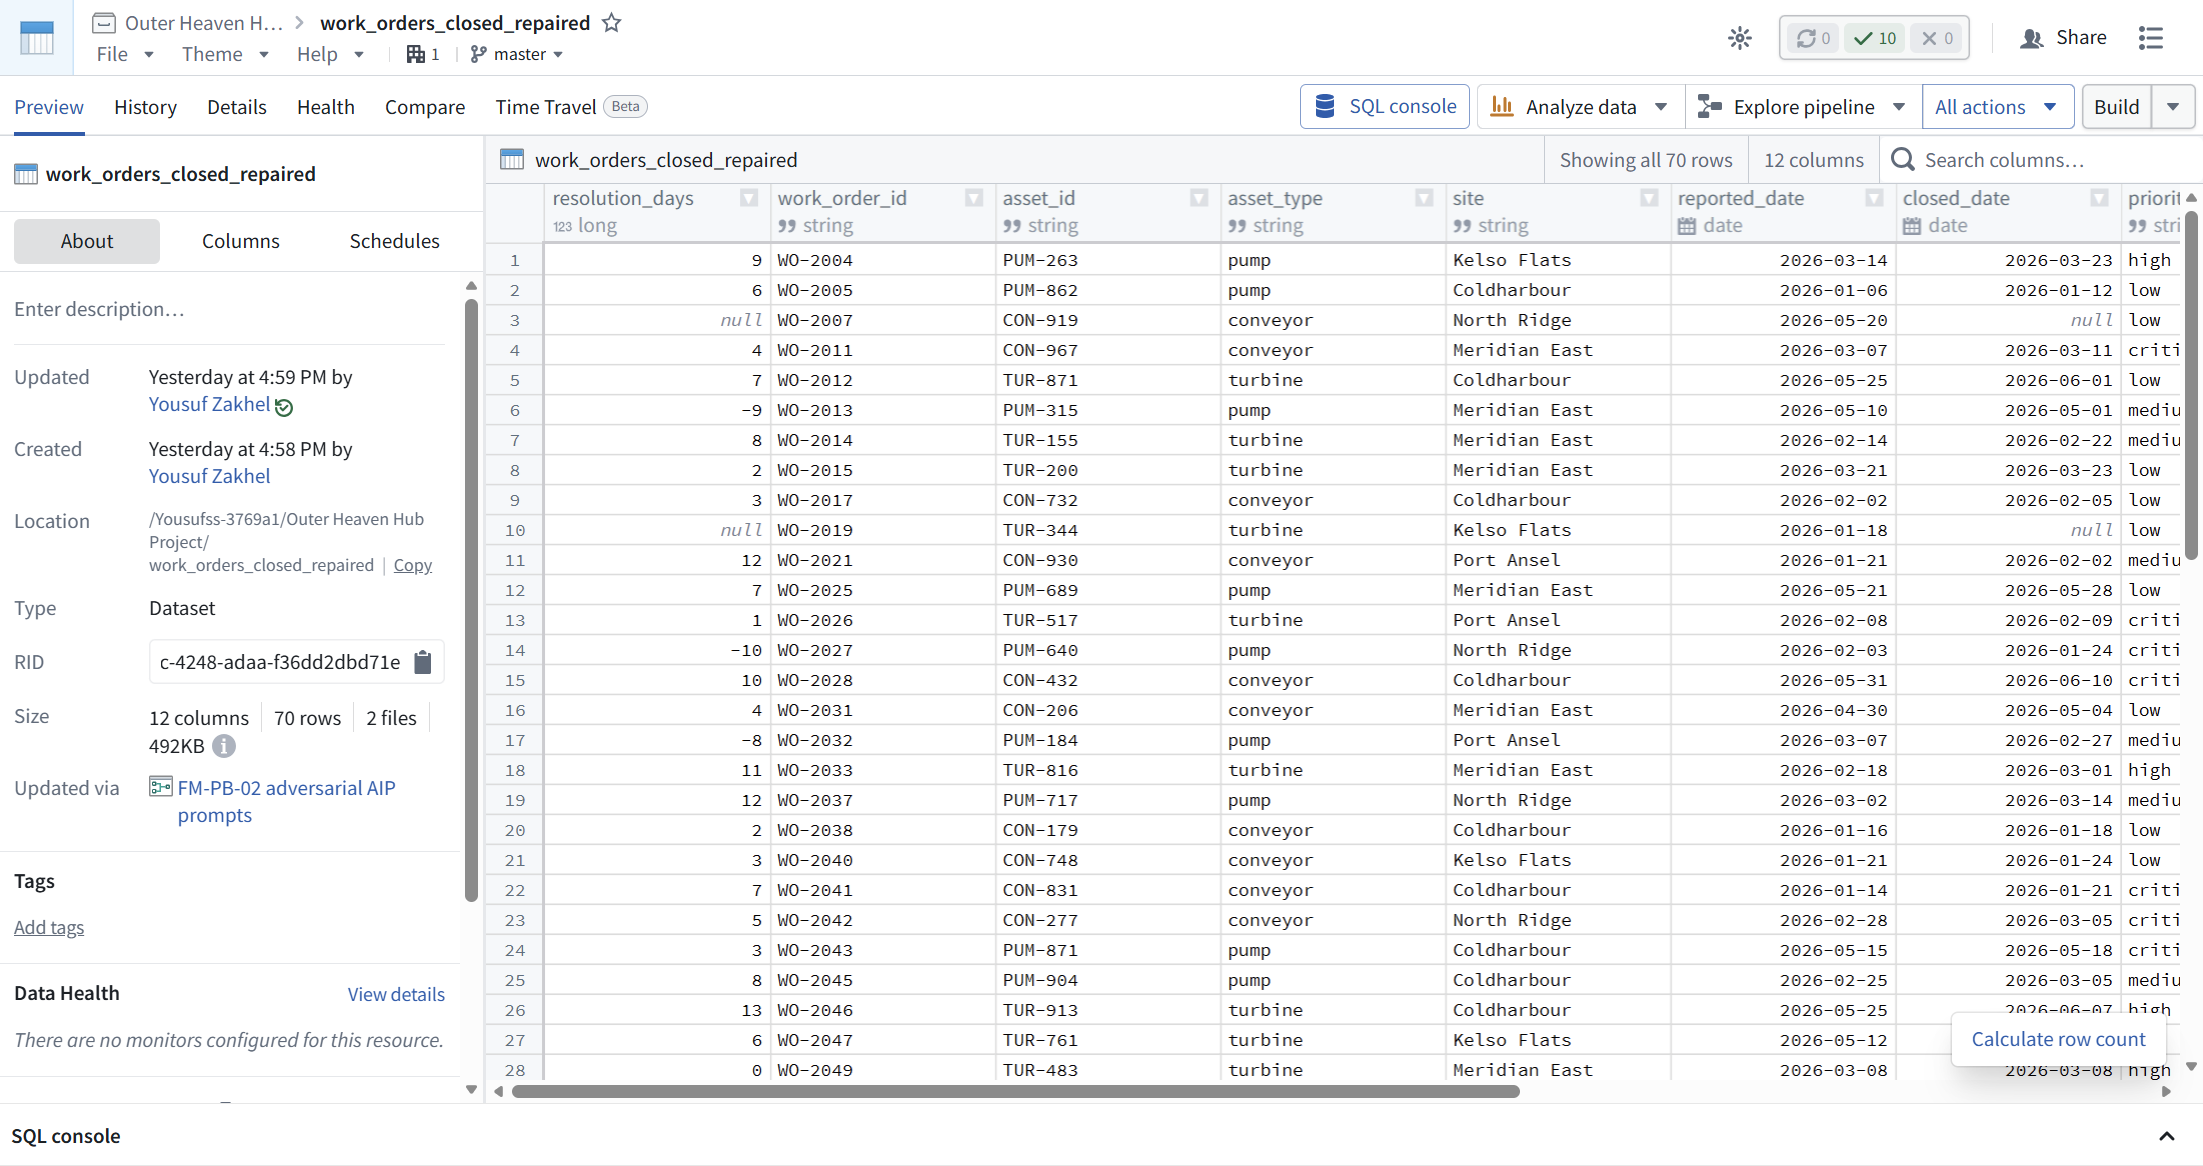
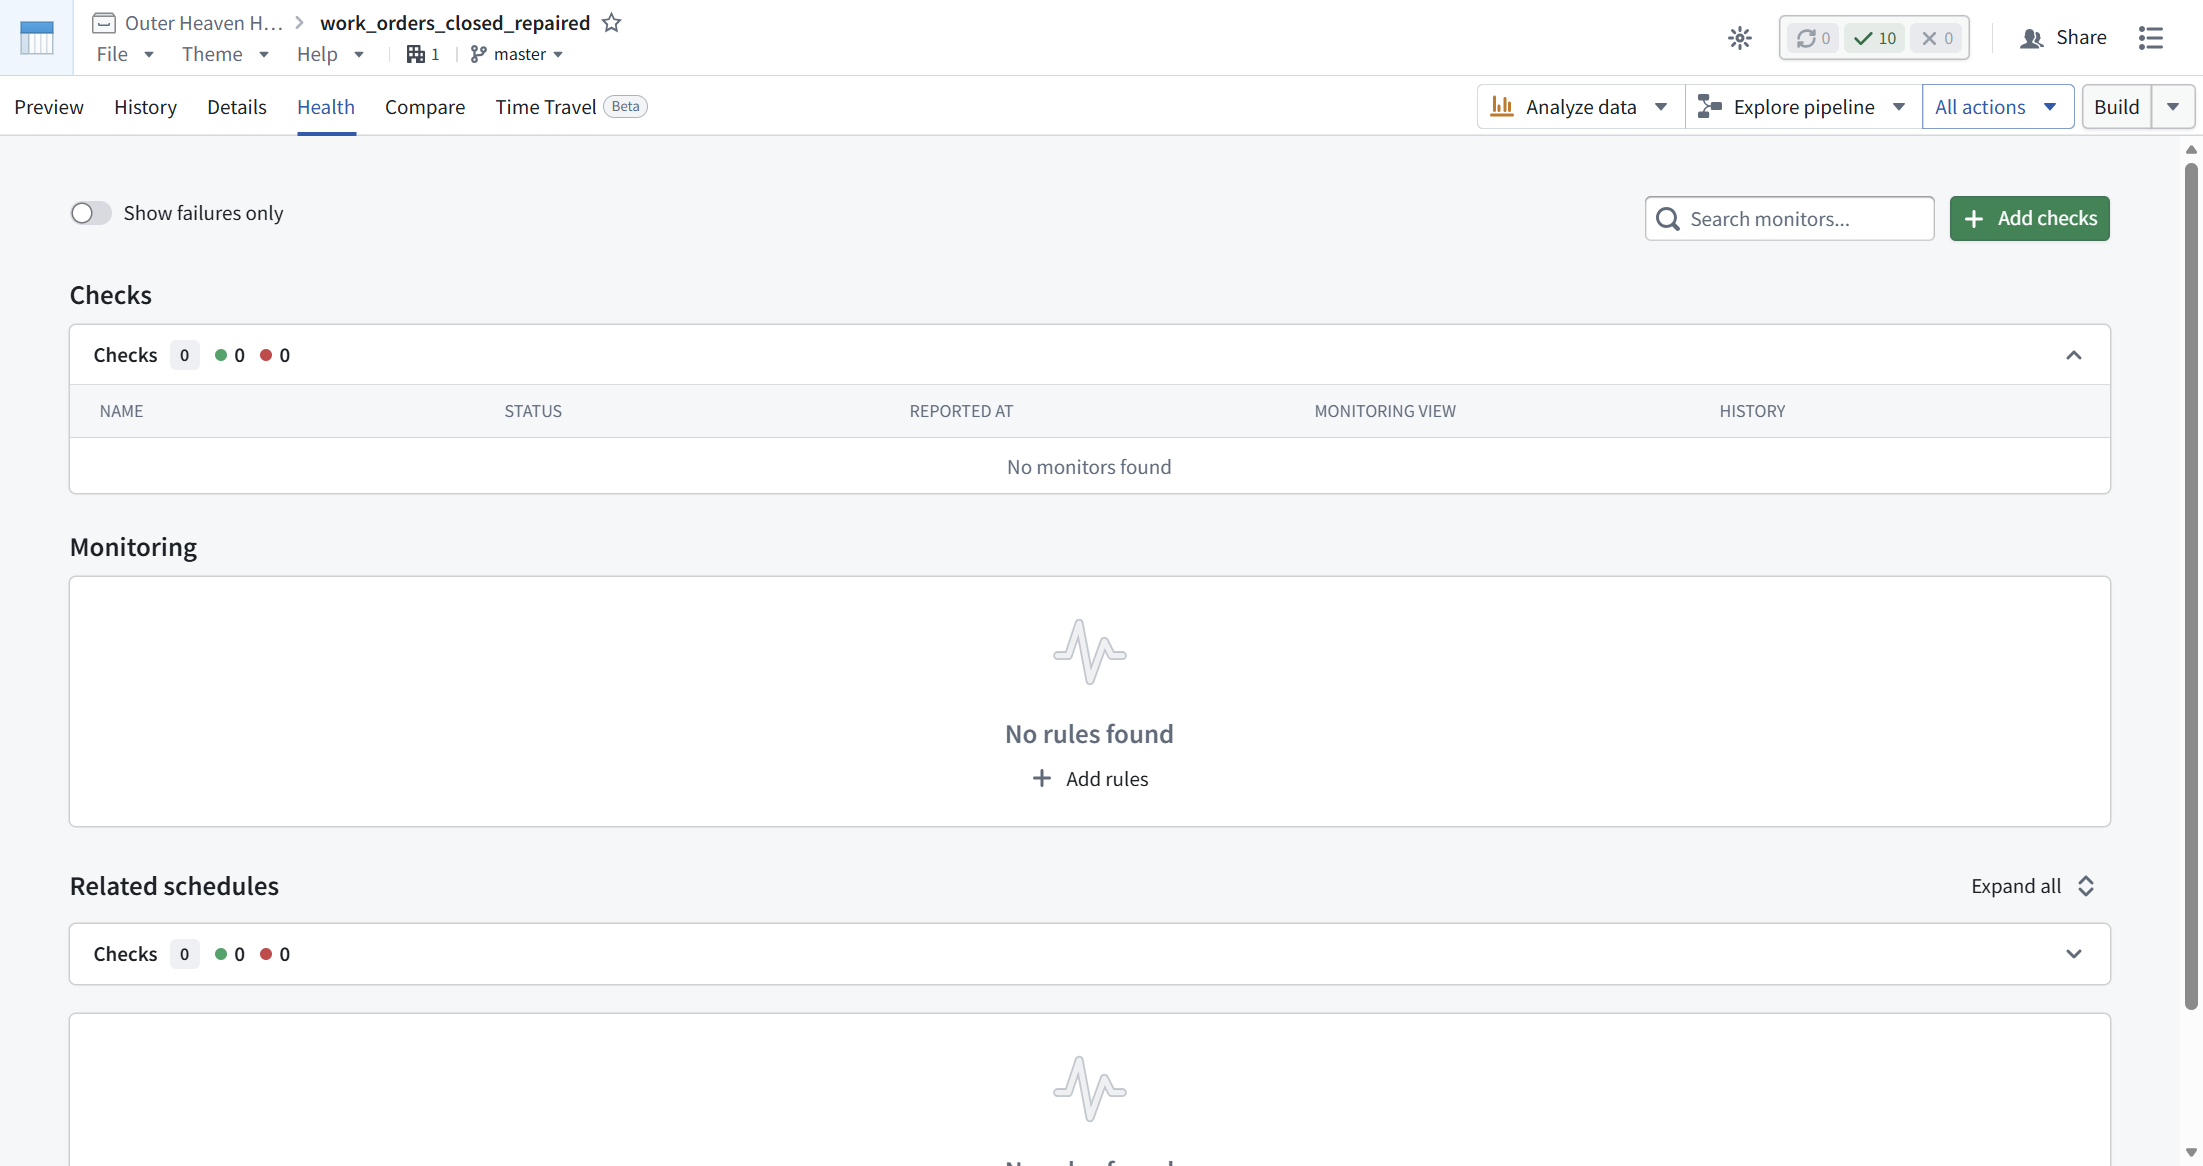
This is not a quirk, it is the architecture: checks attach to datasets, not to pipelines. Any dataset can carry them, whether or not a pipeline built it. The cost is discoverability: a builder who never leaves Pipeline Builder never sees data quality at all.
[ STEP 2: THE CHECK PICKER ]
"+ Add checks" opens a categorized picker. Verbatim inventory:
- Status: Build status, Job status, Sync status.
- Time: Build duration, Data freshness, Job duration, Sync duration, Sync freshness, Time since last updated.
- Size: Dataset file count, Dataset partition, Row count, Transaction file count, Transaction file size.
- Content: Allowed column values, Approximate column relation, Approximate unique percentage, Column regex, Date range, Null percentage, Numeric mean, Numeric median, Numeric range, Primary key.
- Schema: Column, Column count, Schema.
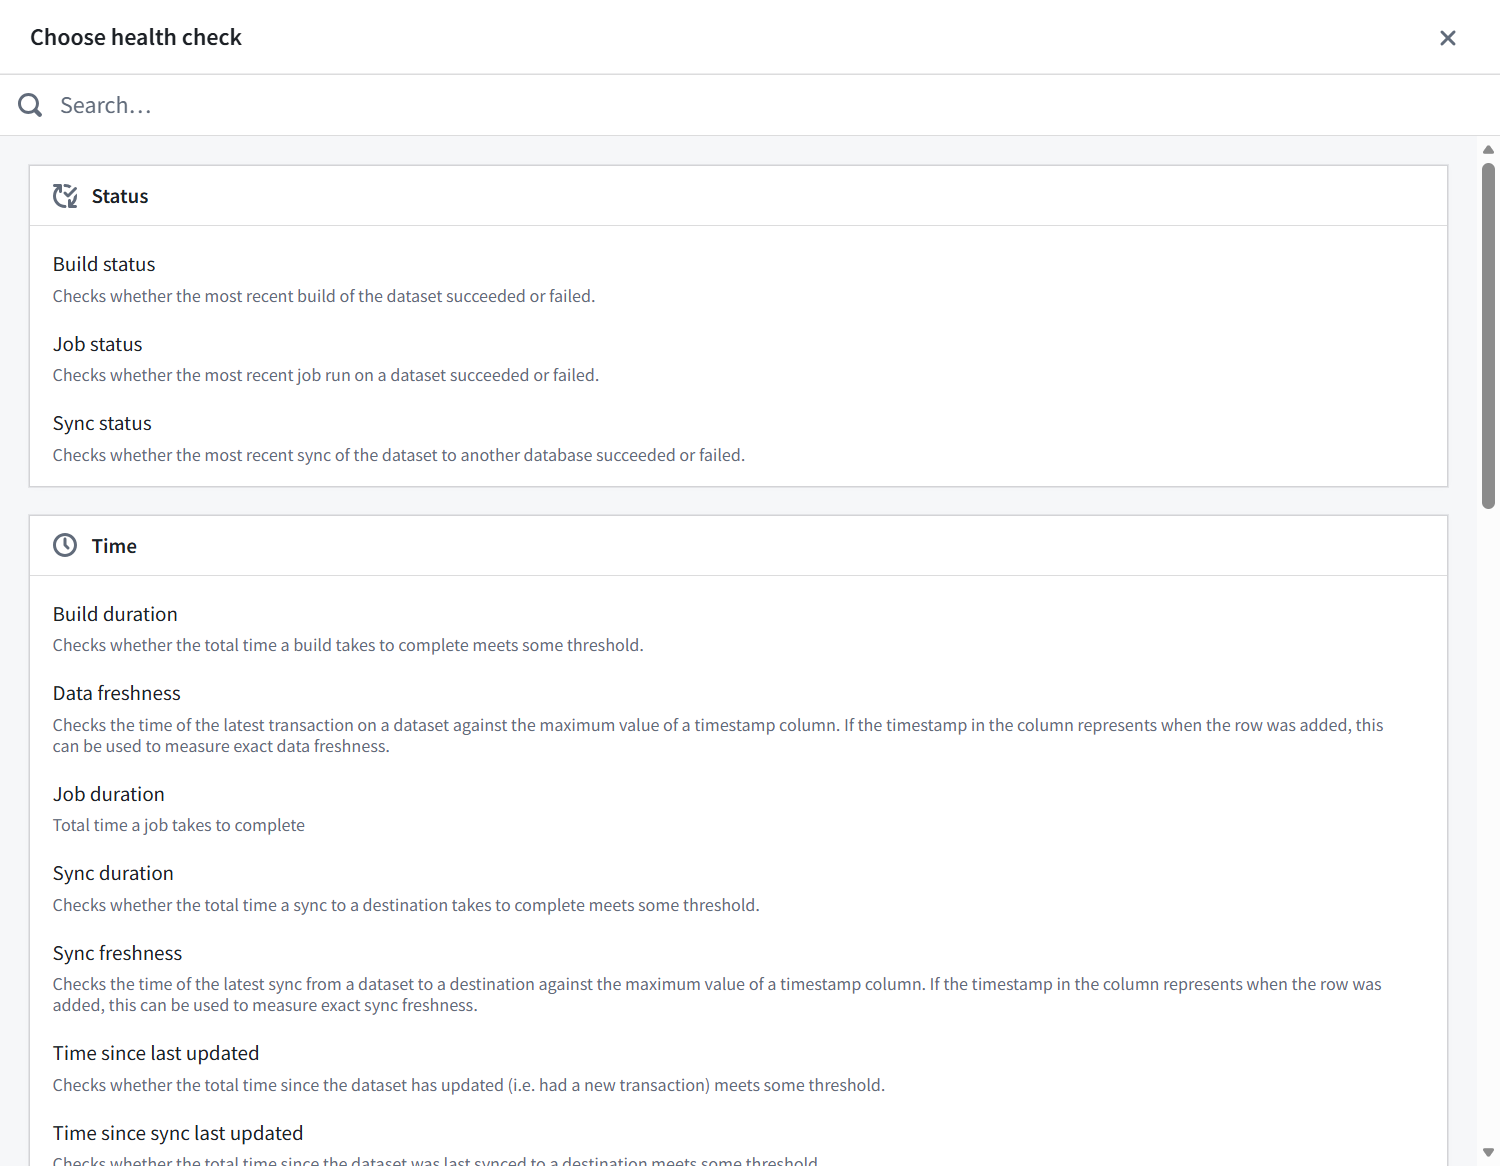
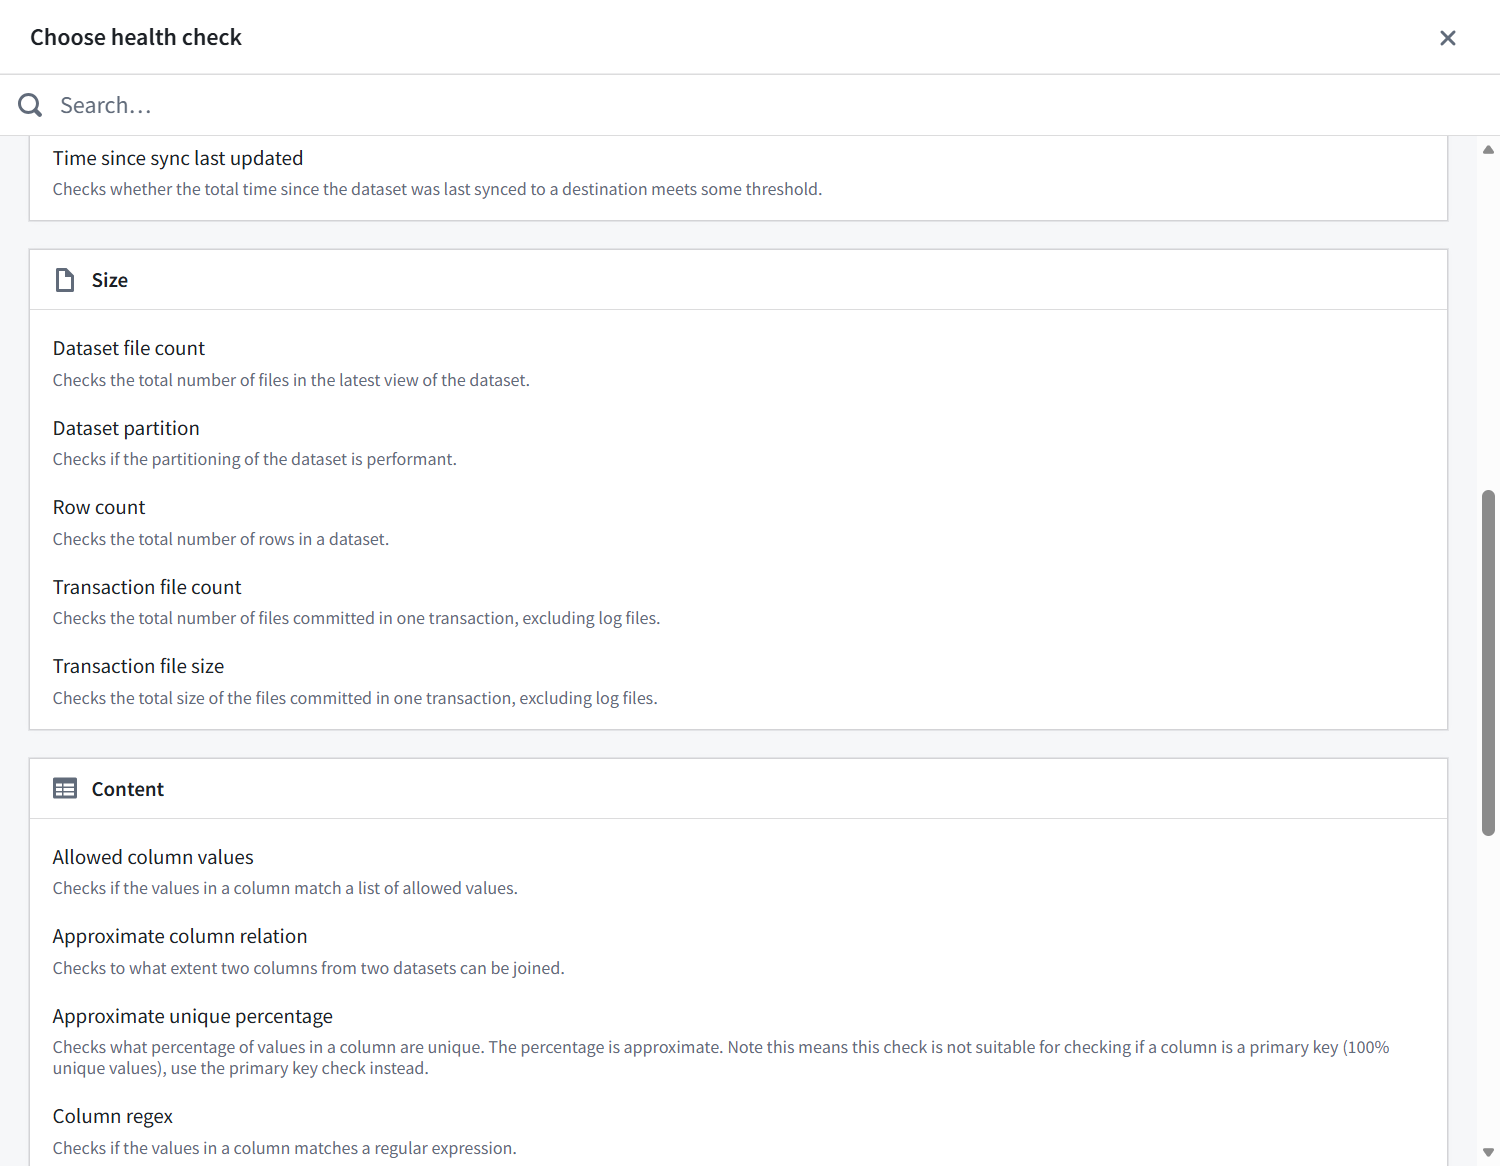
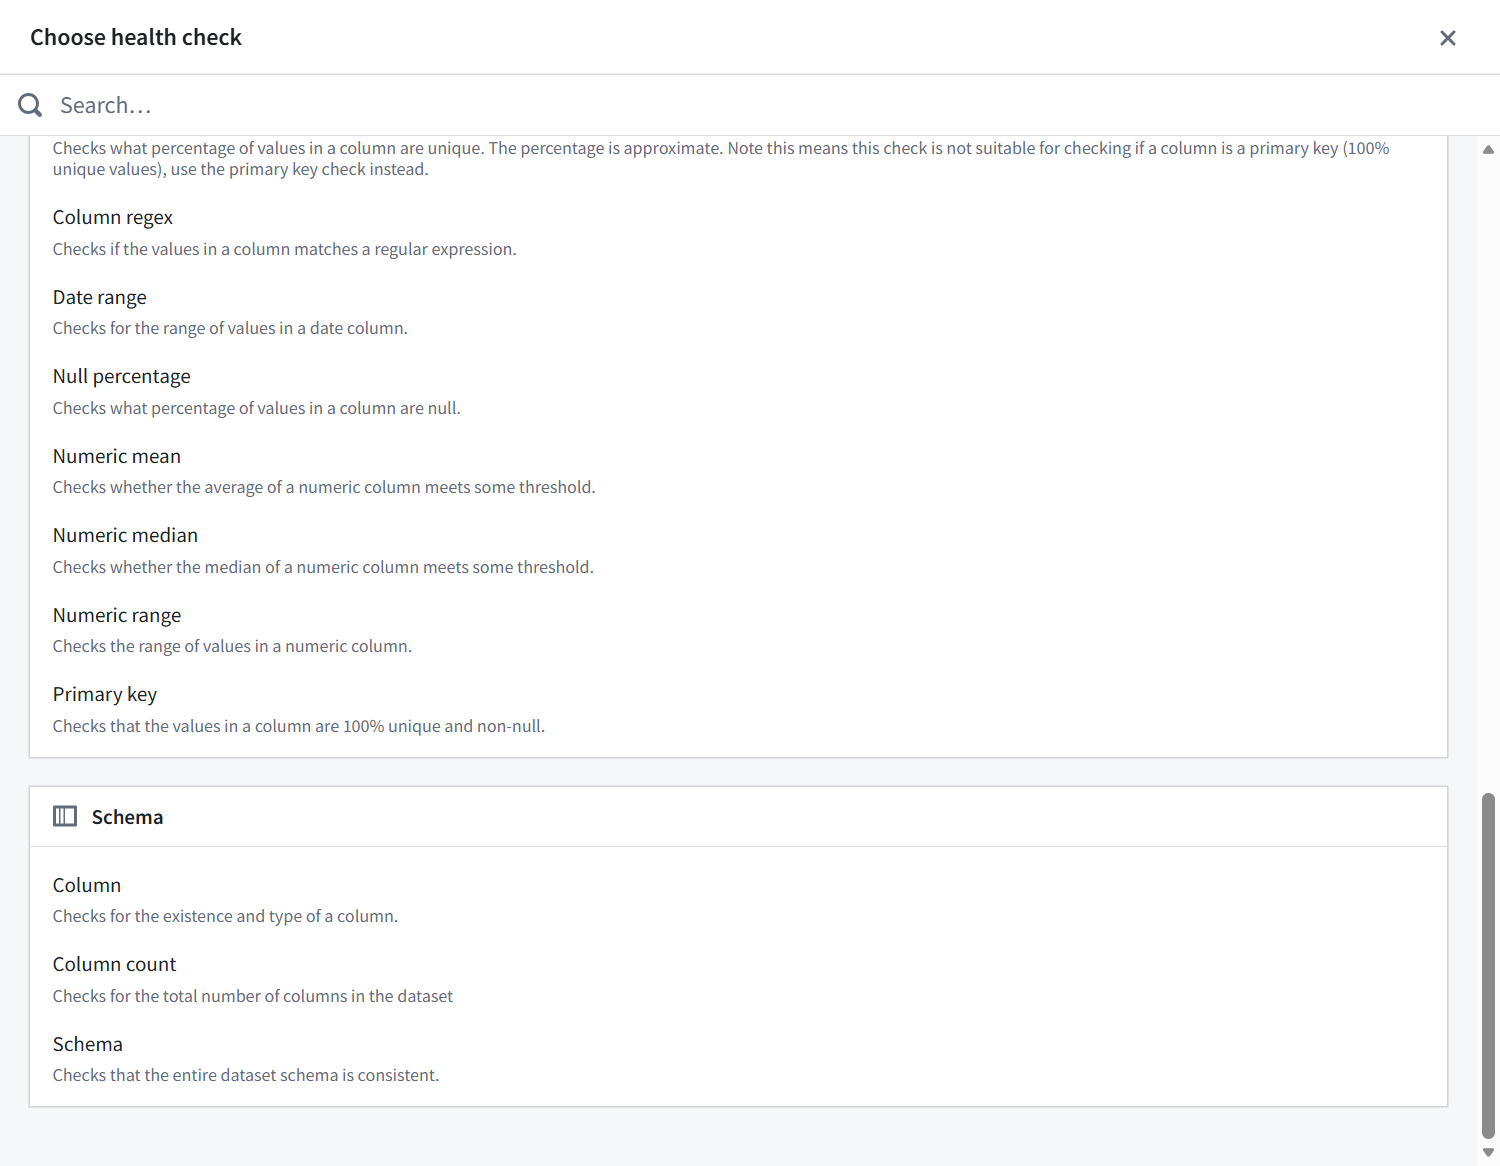
Two things to know. Content is where data-quality work lives. And the column picker lists every column regardless of check type, with no type filtering; choosing a sensible column is on you.
[ STEP 3: A NUMERIC RANGE CHECK ]
Add a Numeric range check on resolution_days. The editor has three moving parts:
- Comparator. Single-bound (at least, at most) or "in between" with a lower and an upper bound. We wanted resolution_days at least 0.
- Severity. Exactly two levels exist: Moderate ("Alerts for moderate level errors") and Critical ("Alerts for the most severe errors"). Read that again: two levels, and the only difference is alerting wording. Neither blocks a build. There is no blocking severity.
- Note. Free text. We wrote: synthetic trap data, 4 of 70 rows carry negative resolution_days down to -10, expected to fail on the current transaction. Write notes for the person who gets paged; Step 7 shows where this text ends up.
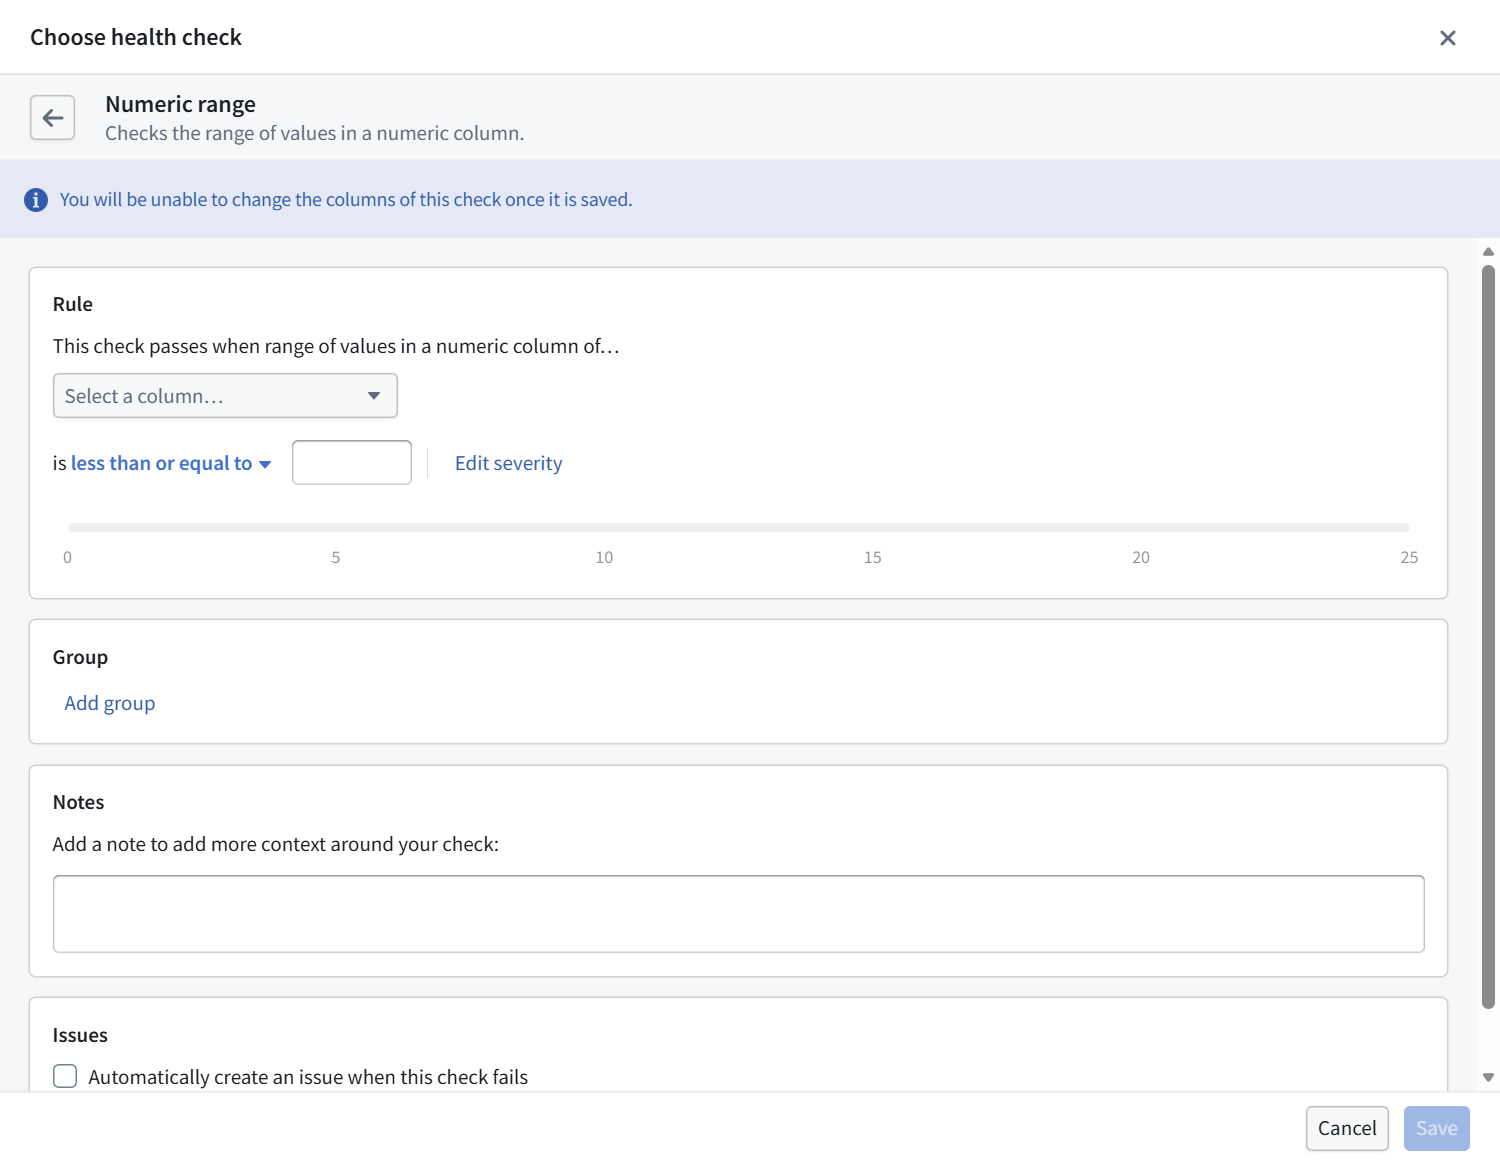
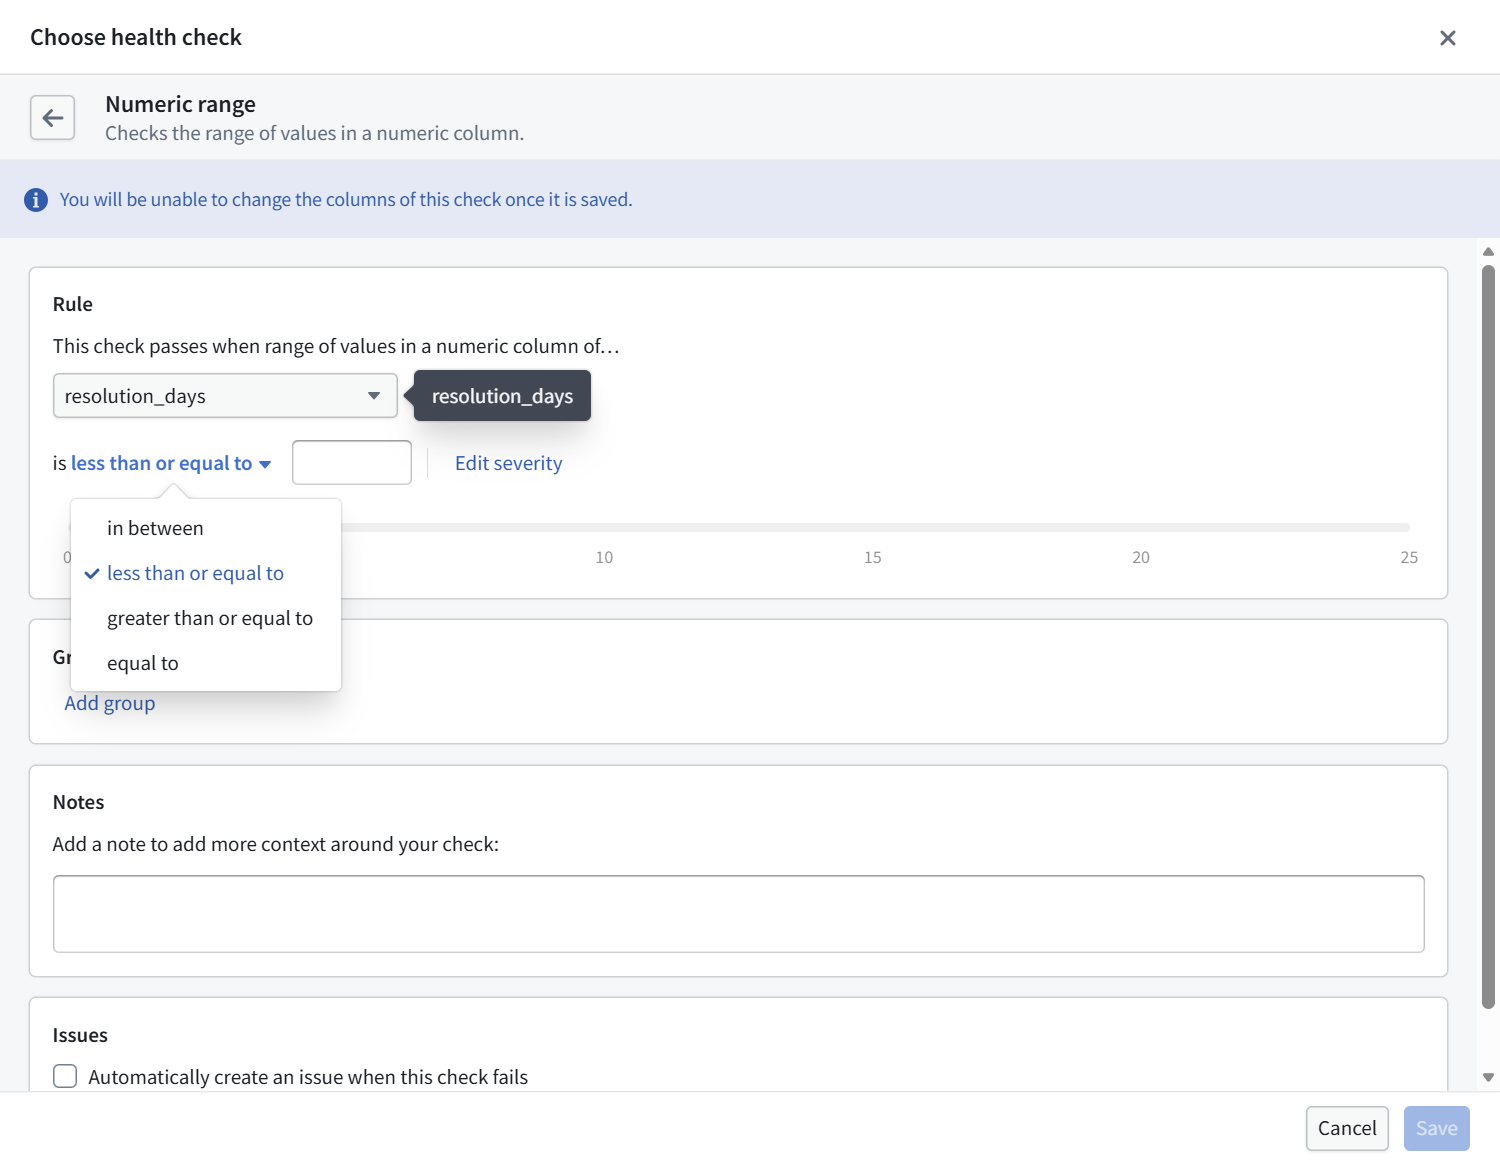


The best surface in the whole flow is the editor's live slider: it renders the column's actual data distribution under your bounds, orange where rows would fail, green where they pass. You watch your own data break the rule before you save anything.

Then the editor bit us. With the single-bound comparator set to "at least" and the bound set to exactly 0, Save stayed disabled with the tooltip "Must specify either an upper or a lower bound". The bound was specified. The editor treats an entered 0 as no value. The workaround: switch the comparator to "in between", set the lower bound to 0, leave the upper bound blank. Save enables. The full reproduction is FIELD REPAIR 1; it is specific to Numeric range single-bound.
One more constraint, stated on a banner at save time: "You will be unable to change the columns of this check once it is saved". The edit view repeats it: "Unable to change the columns of an existing check. To make edits replace this check with a new one." Columns are immutable. Bounds, severity, and notes are not.
[ STEP 4: A NULL PERCENTAGE CHECK ]
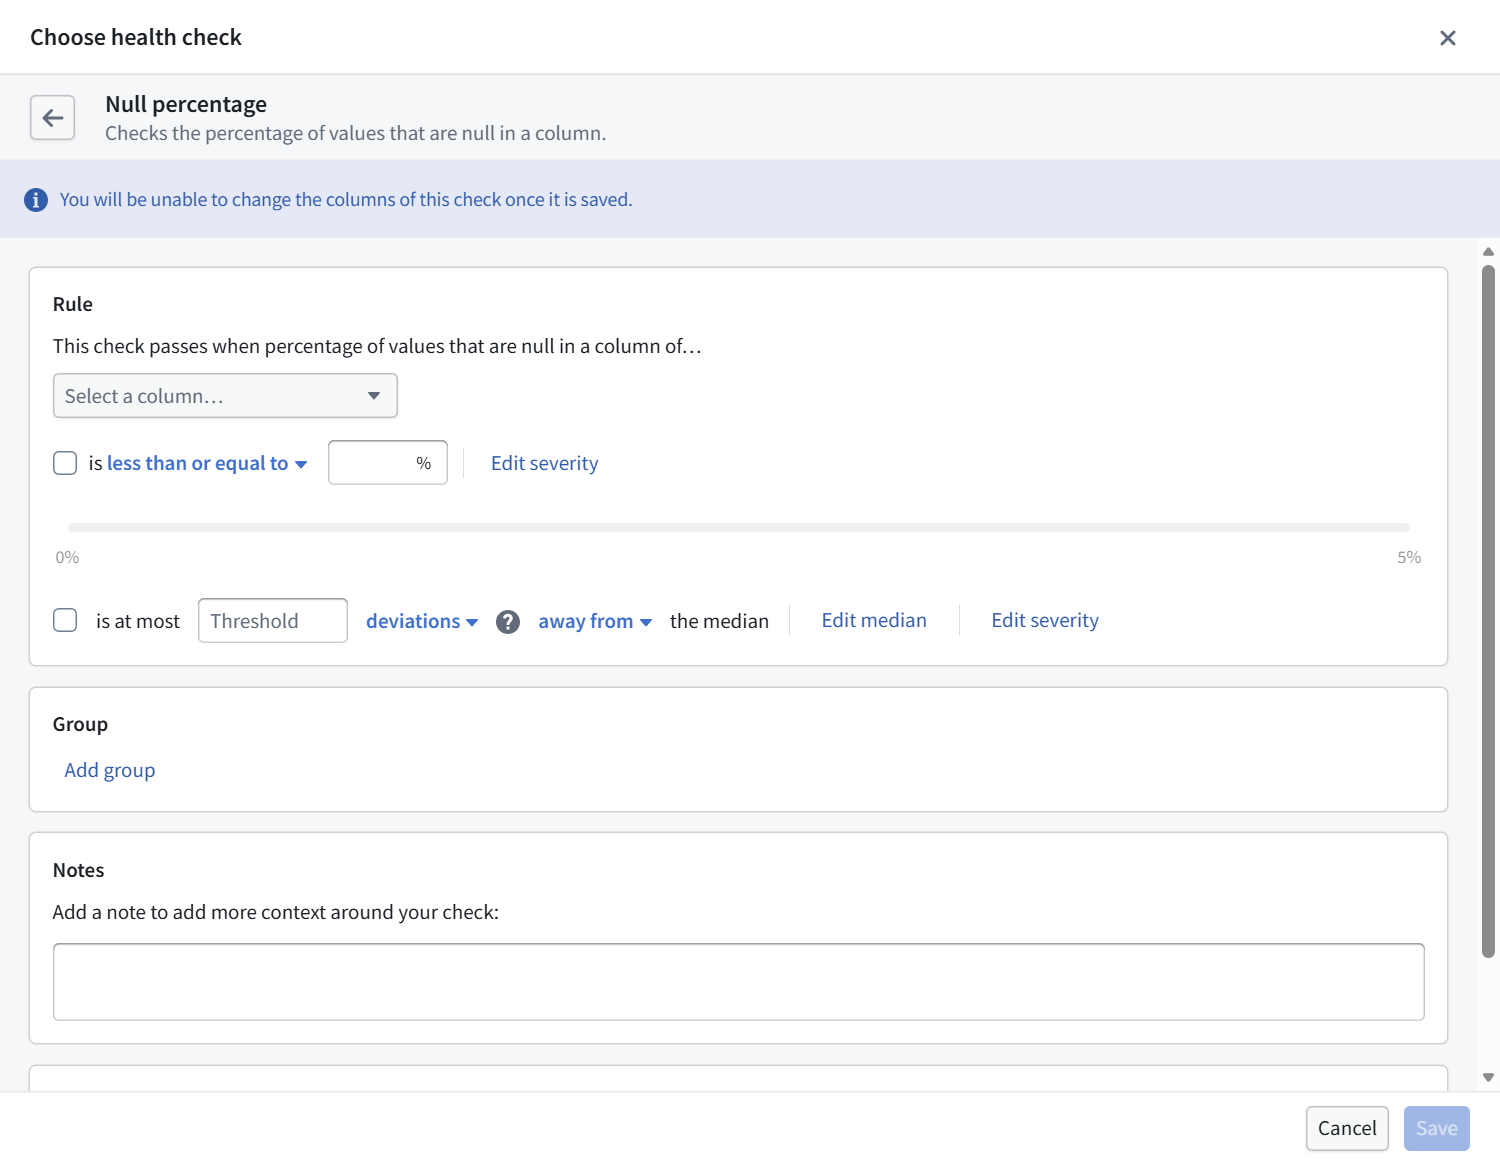
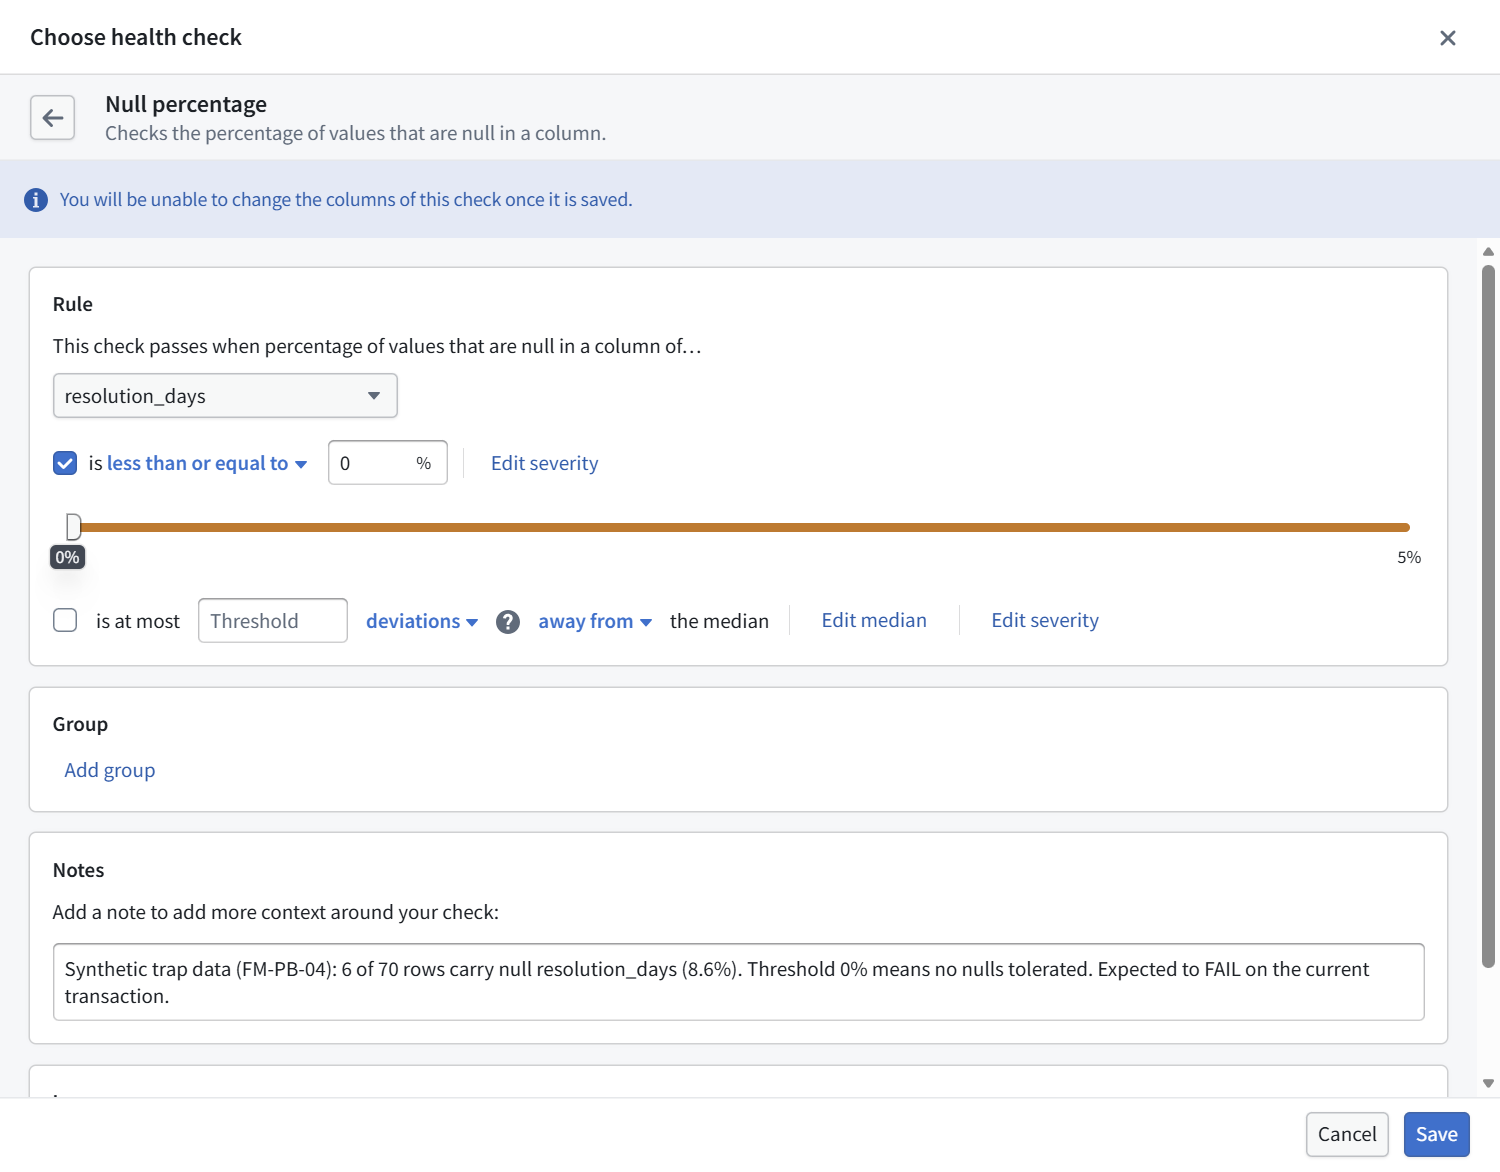
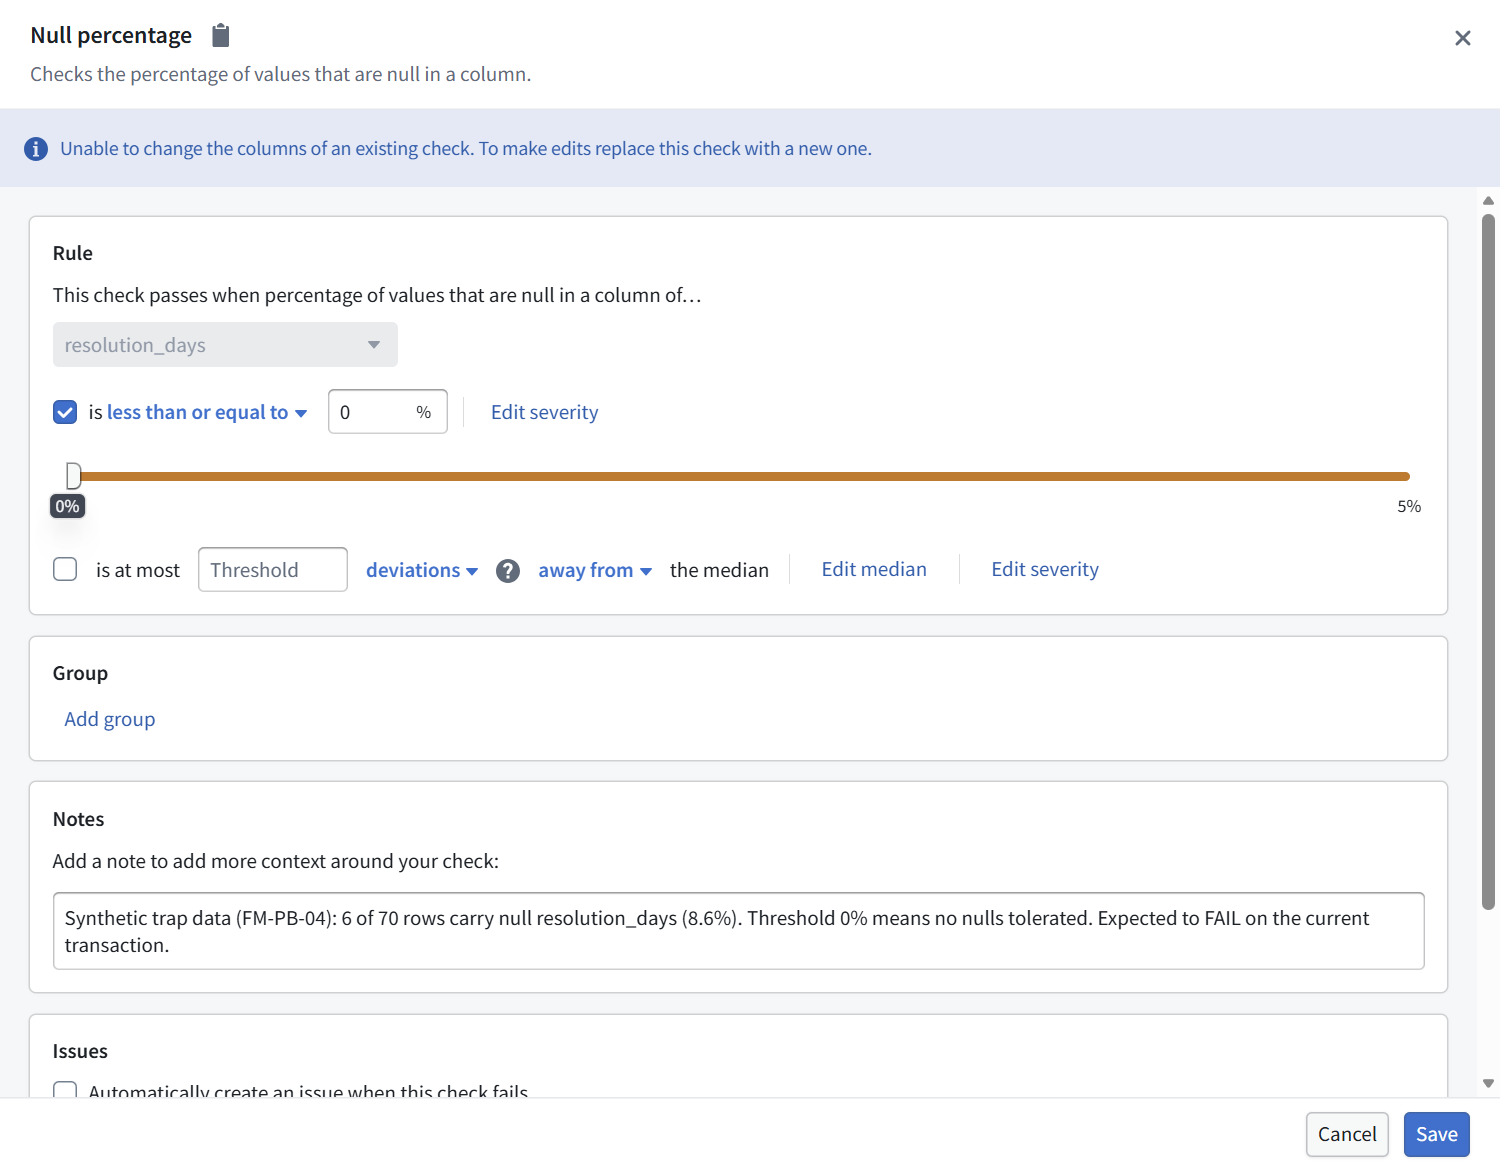
Second check: Null percentage on resolution_days, comparator "at most 0%", Moderate. Note text: synthetic trap data, 6 of 70 rows carry null resolution_days (8.6%), threshold 0% means no nulls tolerated, expected to fail on the current transaction.
This check doubles as the control for FIELD REPAIR 1: a bound of 0 saves without complaint here. The falsy-zero behavior is a Numeric range single-bound defect, not a platform-wide rule about zero.
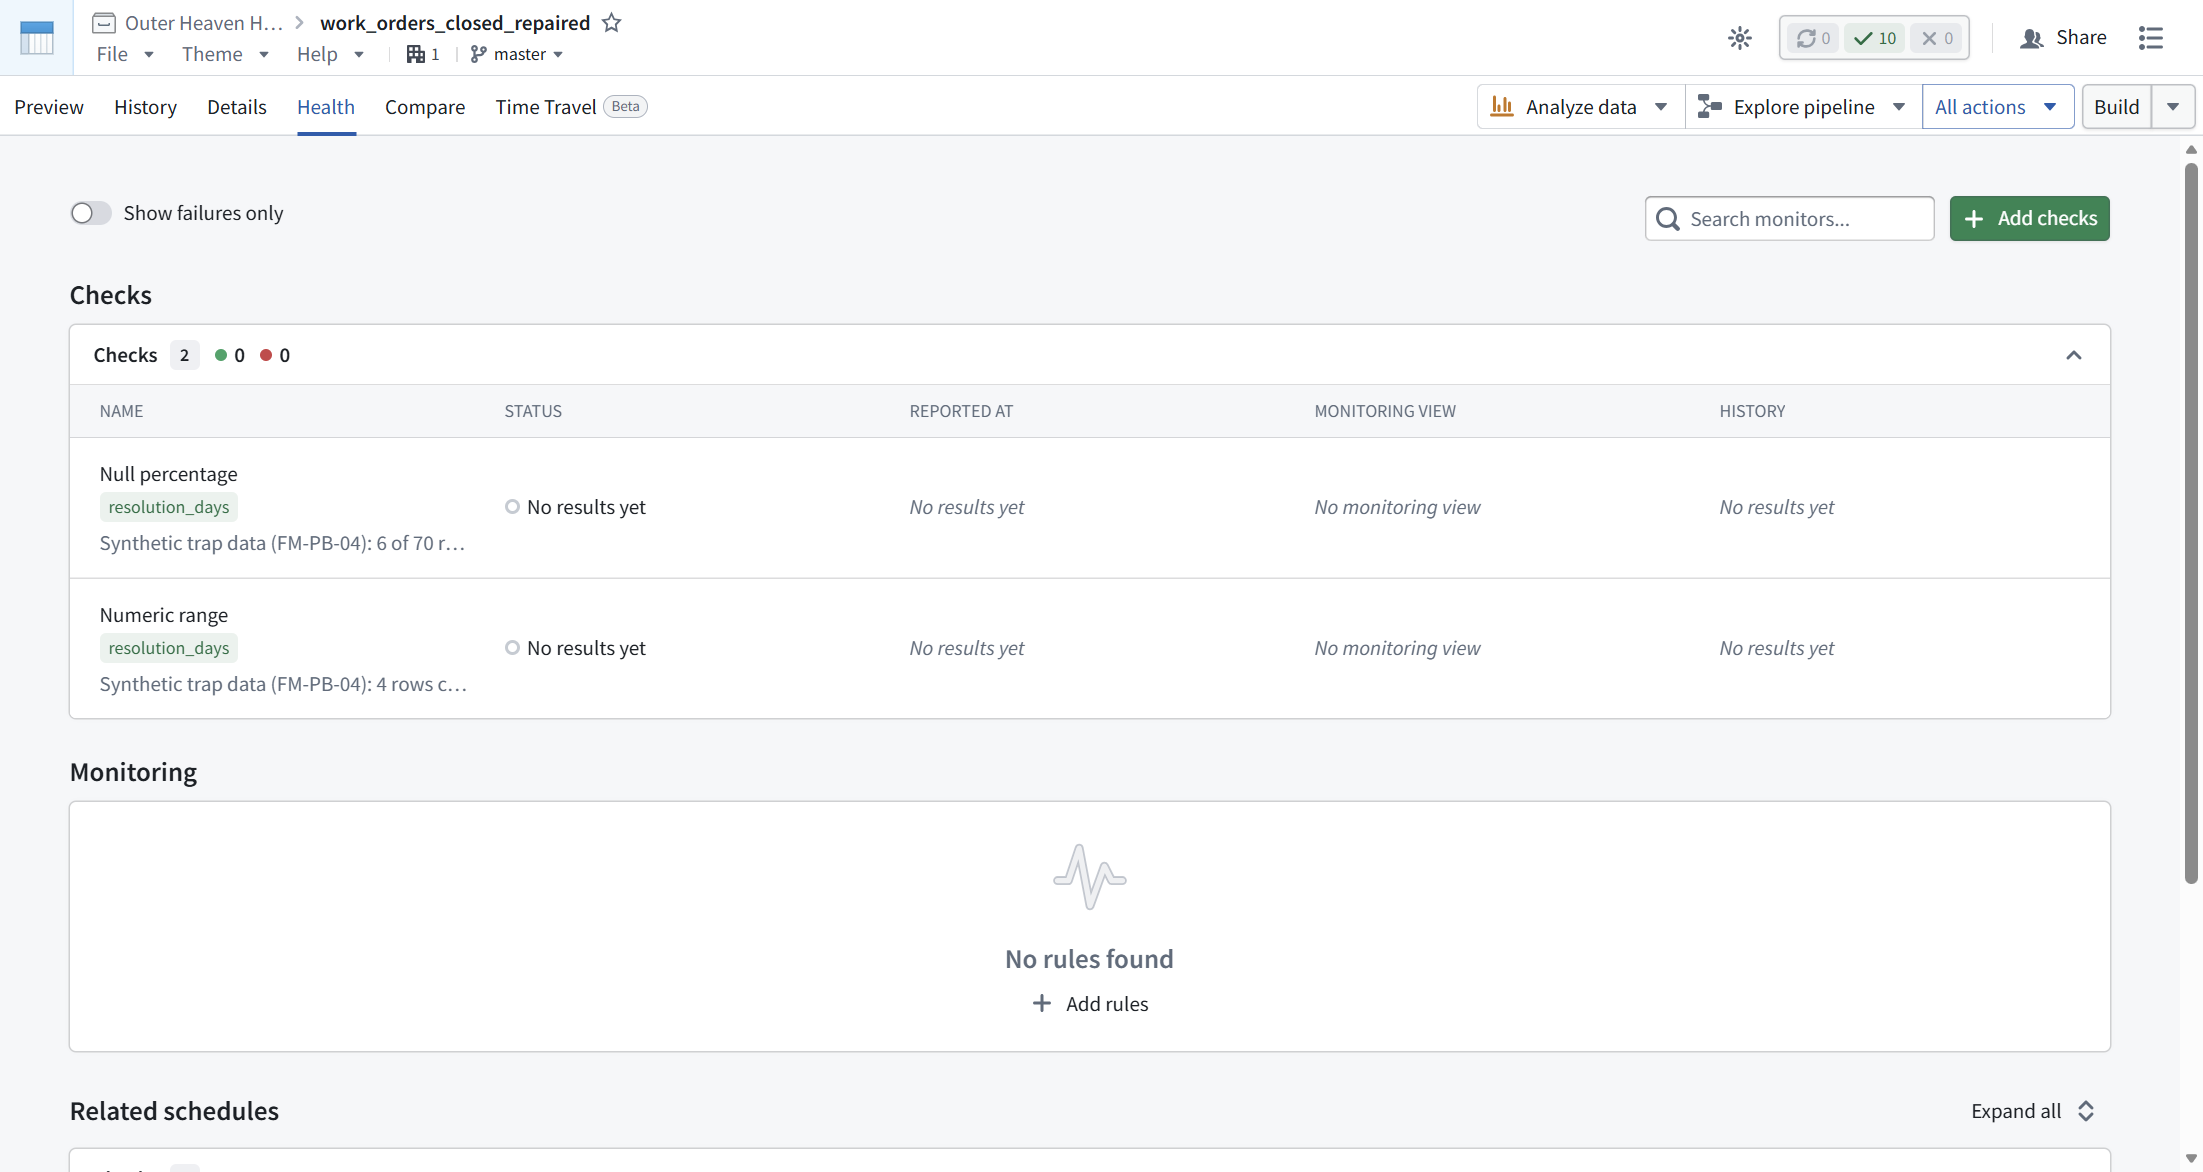
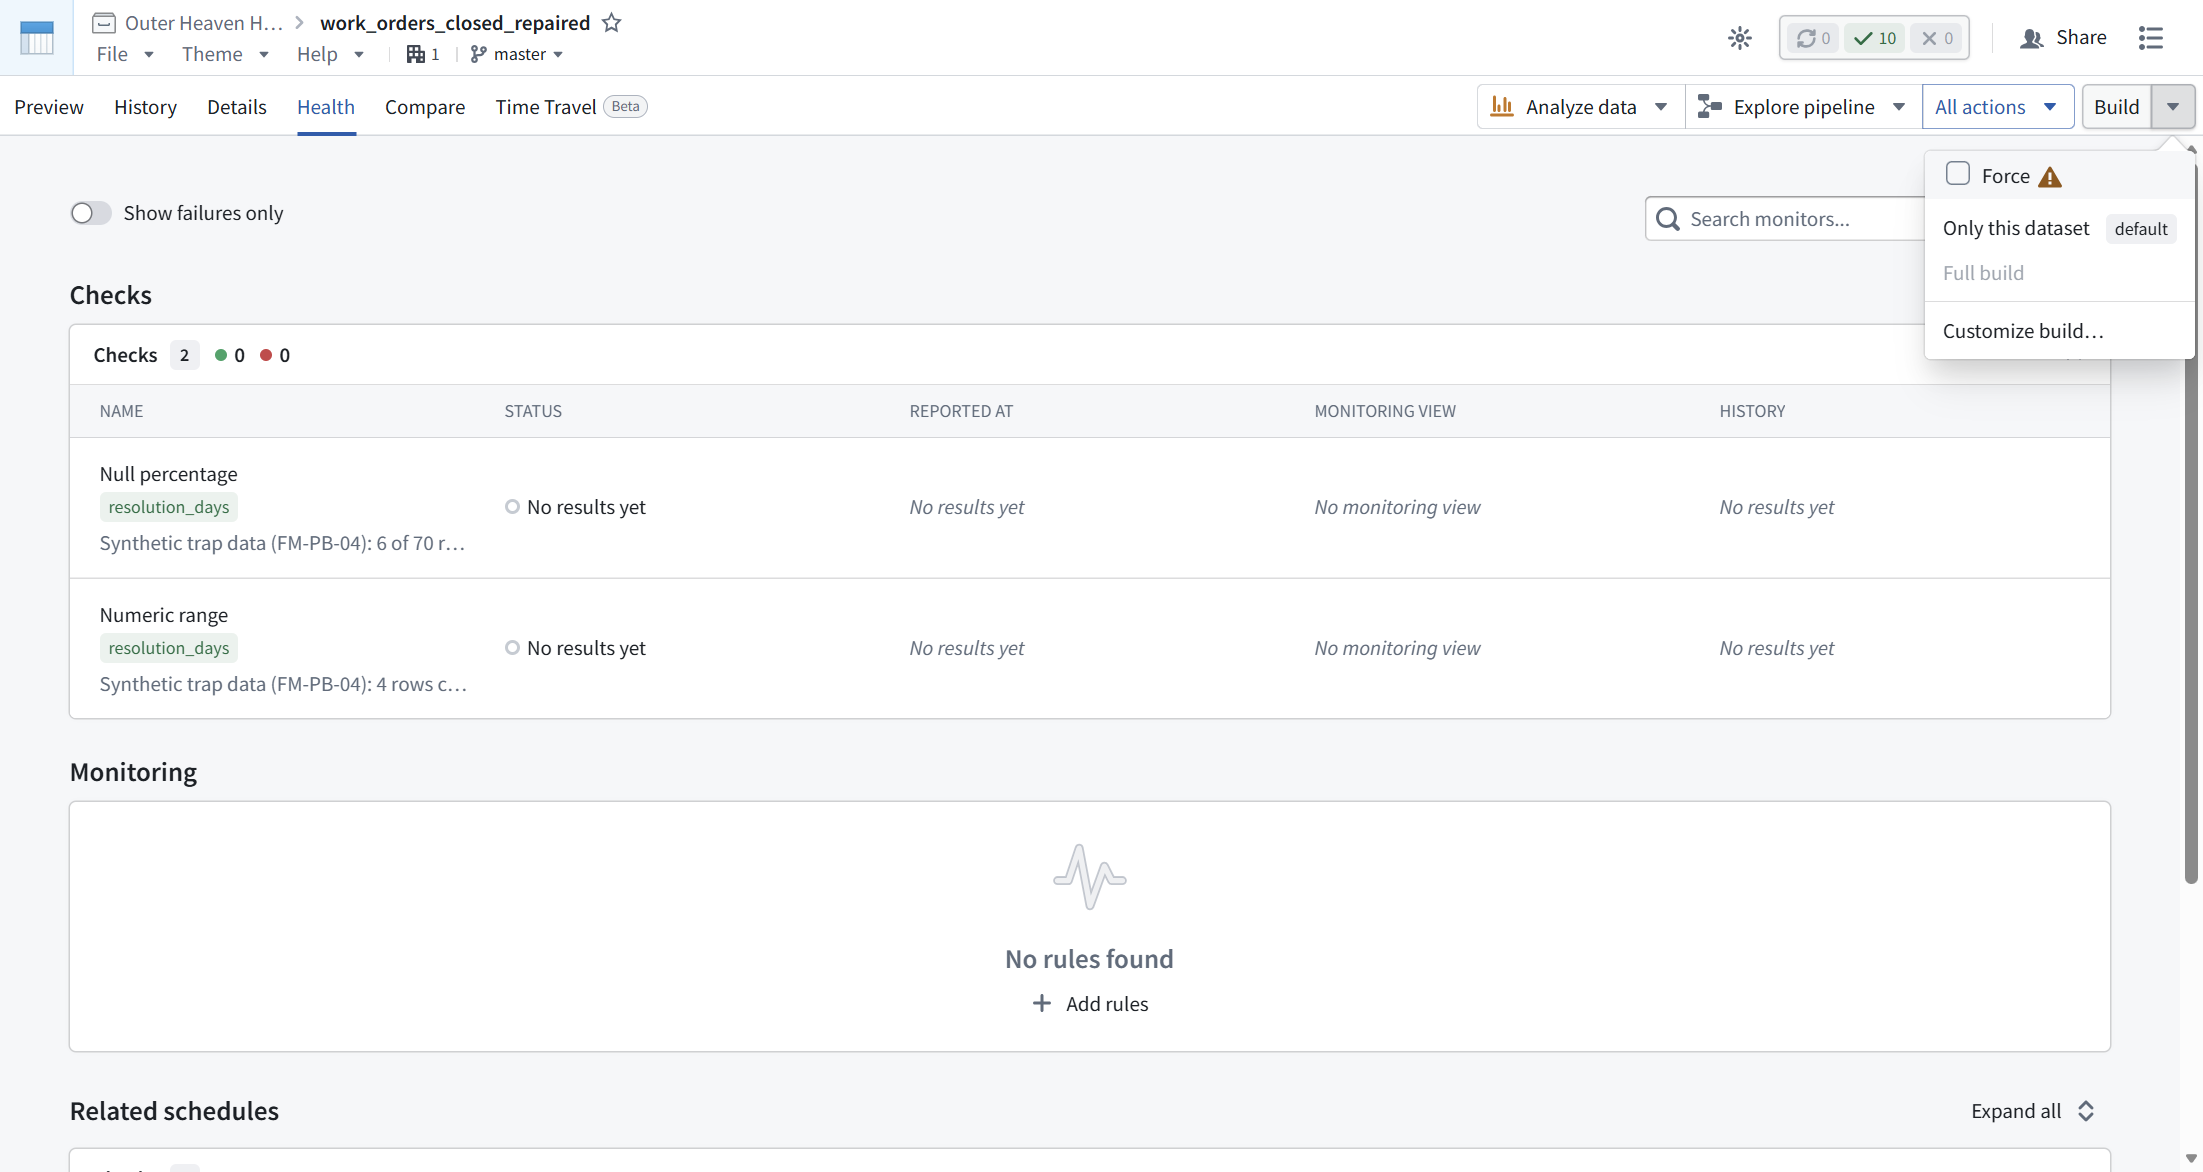
Both checks now listed on the Health tab, both reading "No results yet".
[ STEP 5: CHECKS DO NOT EVALUATE RETROACTIVELY ]
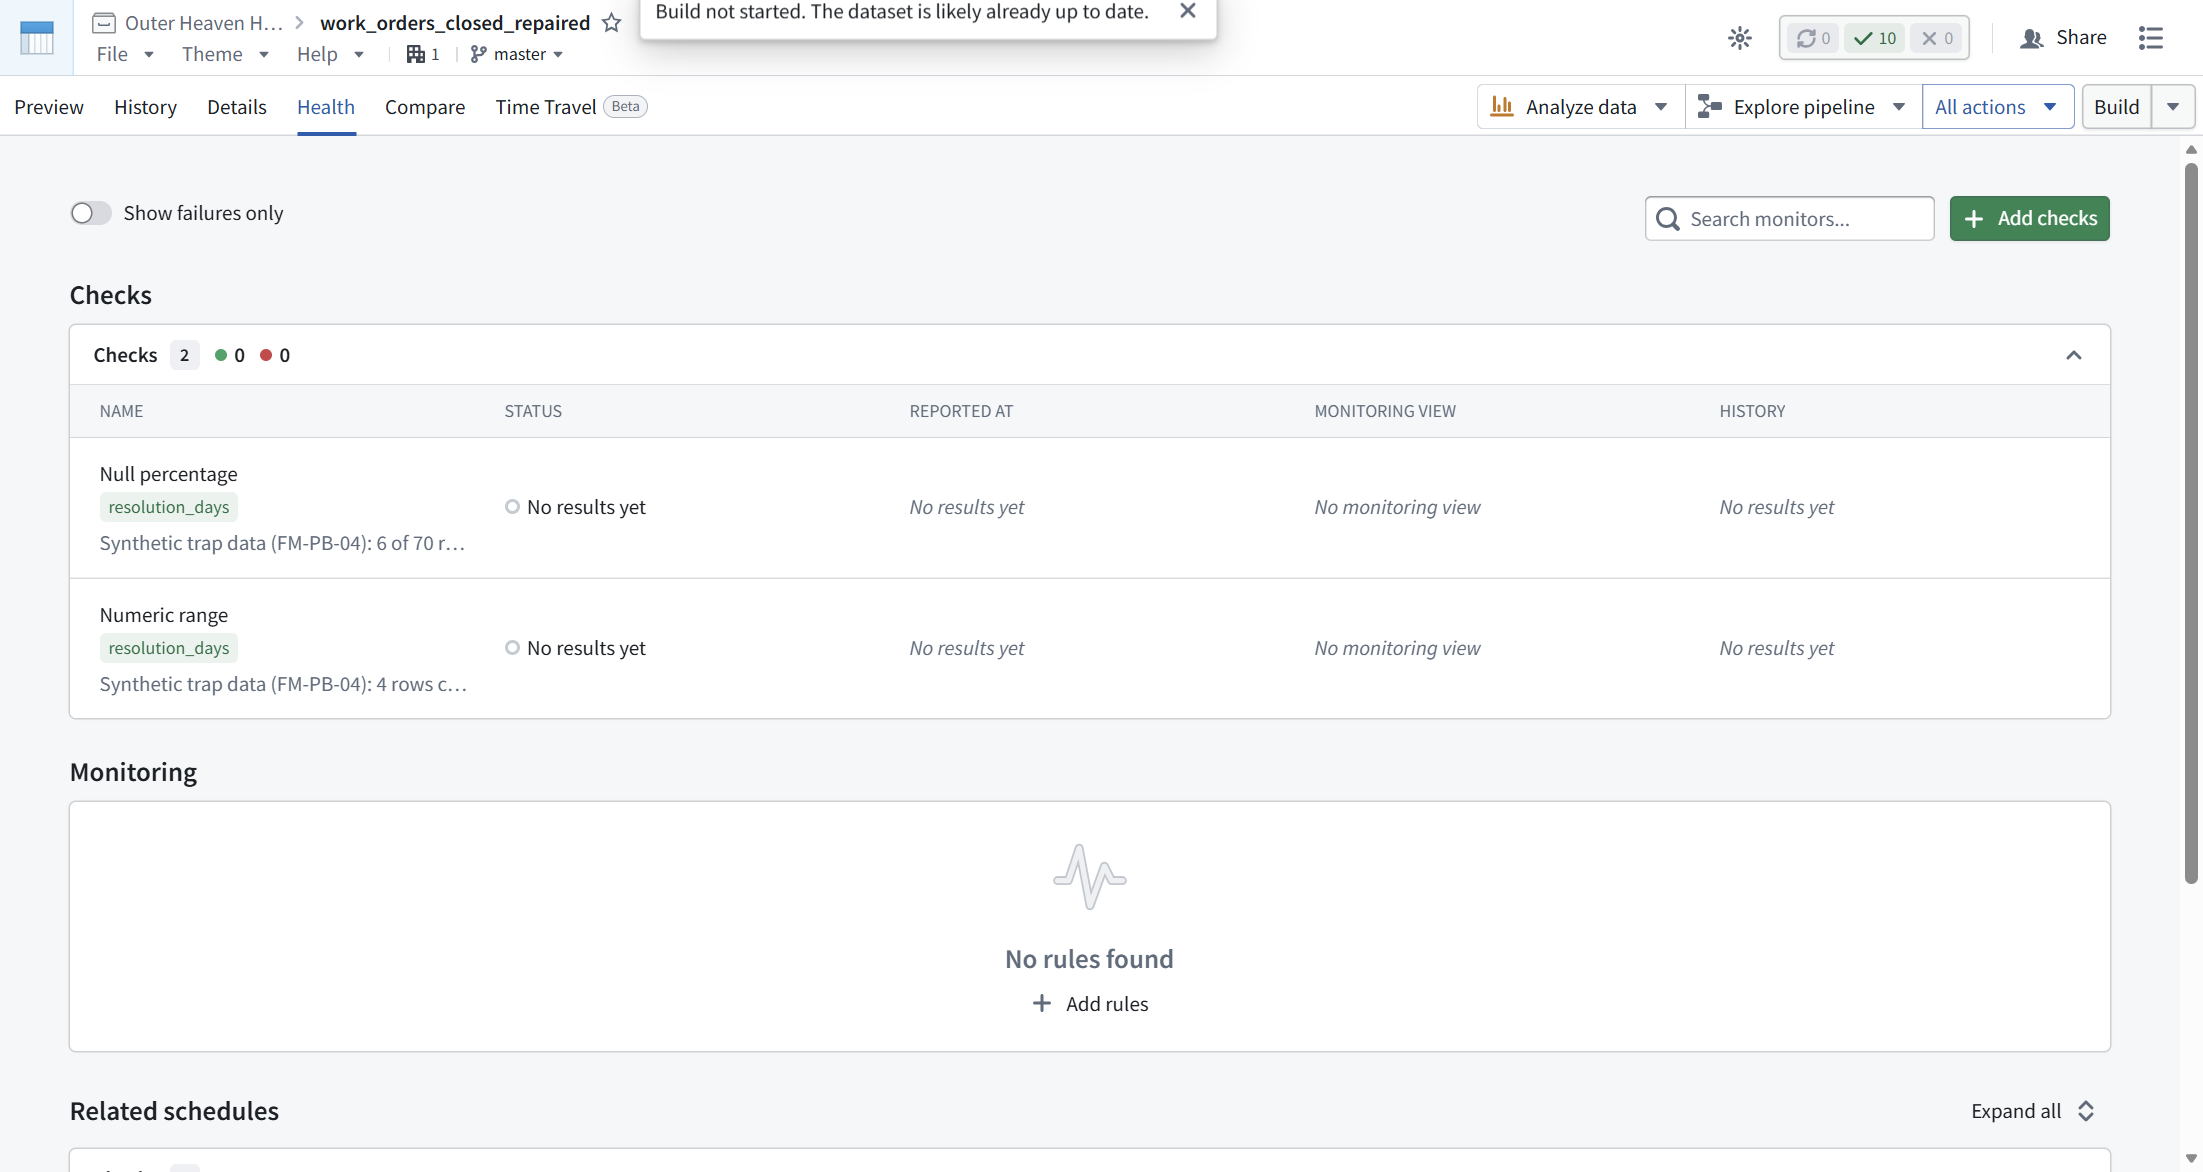
"No results yet" is literal. A saved check does not look at the current transaction; it evaluates on the next one. To get a verdict on demand you need a new transaction, and the platform will not give you one casually: clicking Build on an up-to-date dataset earns the toast "Build not started. The dataset is likely already up to date."
The way through is the caret menu next to Build. Its contents, verbatim: a Force checkbox with a warning icon, "Only this dataset" (the default), "Full build" (greyed out here), and "Customize build...". Check Force, then click "Only this dataset". The build starts.

[ STEP 6: THE CORE FACT ]
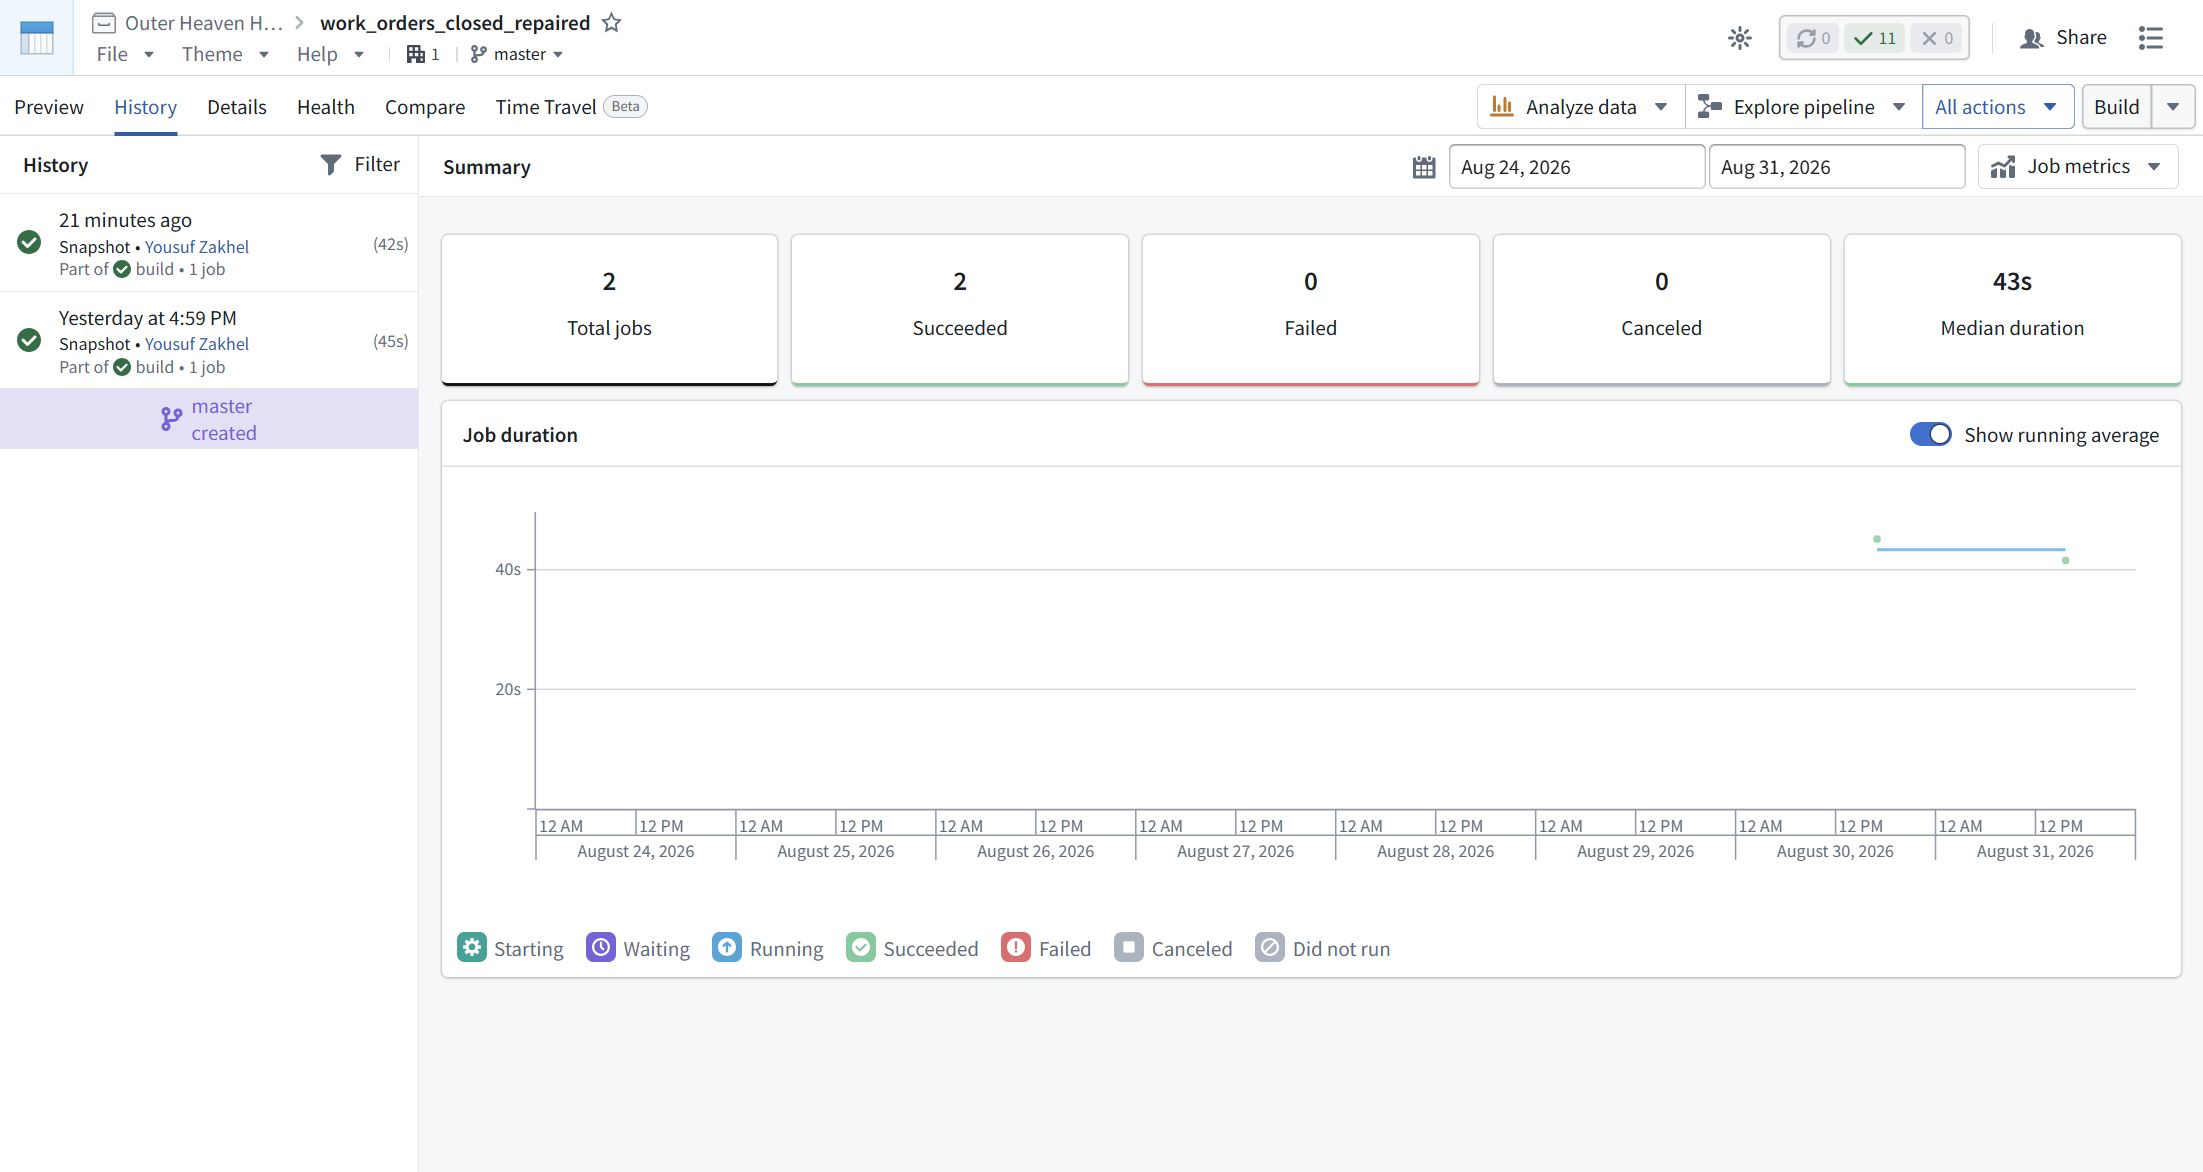
The forced build ran 42 seconds, a Snapshot transaction. The History tab records it: 2 jobs, 2 succeeded, 0 failed, median 43s.
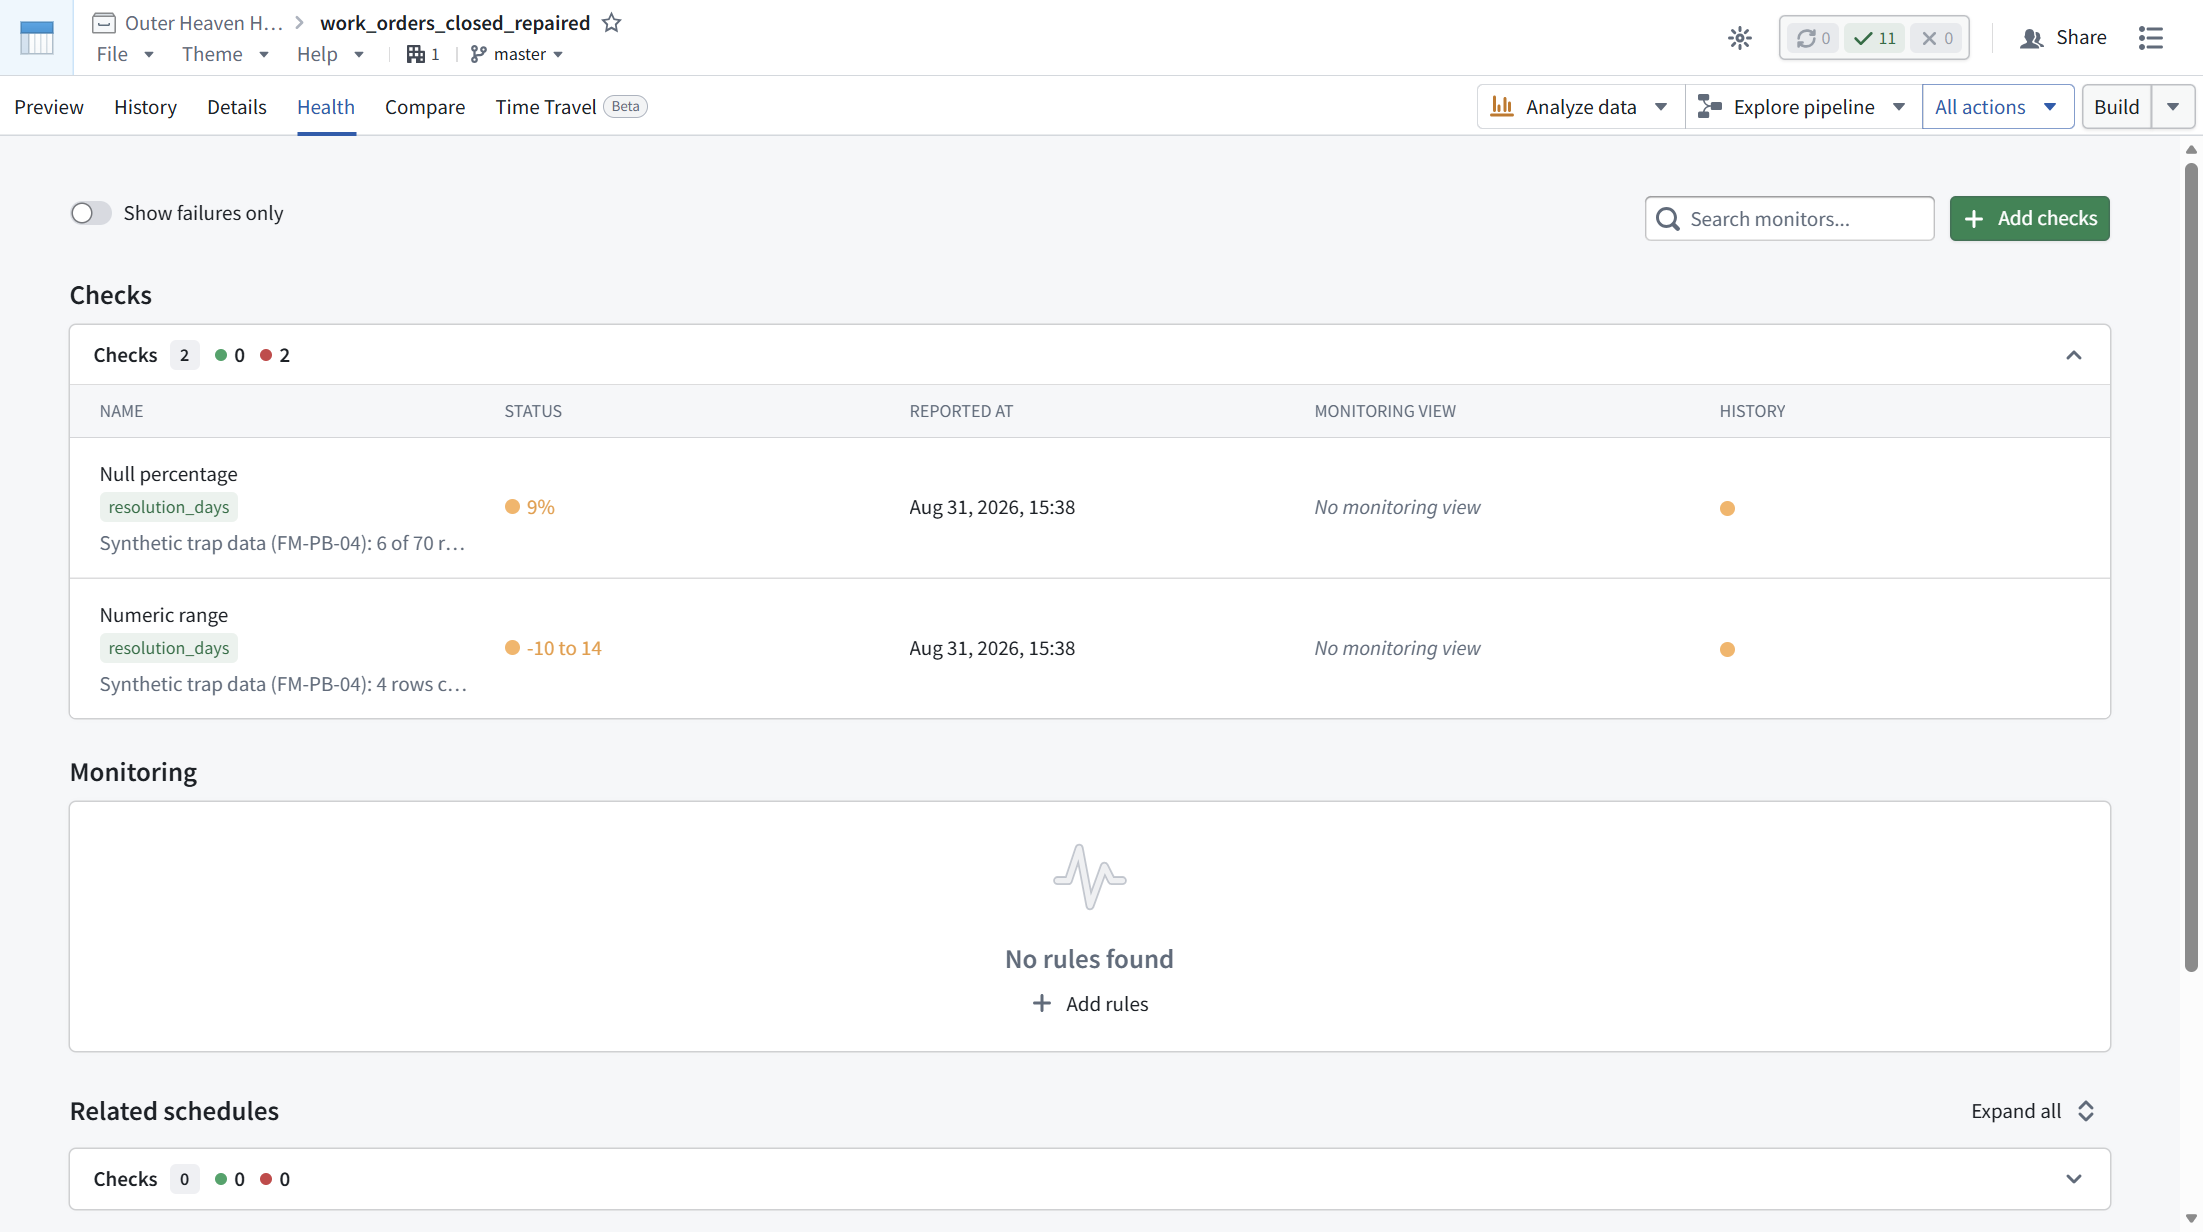
Both checks failed on the new transaction. Null percentage reported "9%". Numeric range reported observed bounds of "-10 to 14". Timestamp Aug 31 2026, 15:38. The header counter went red: 2.
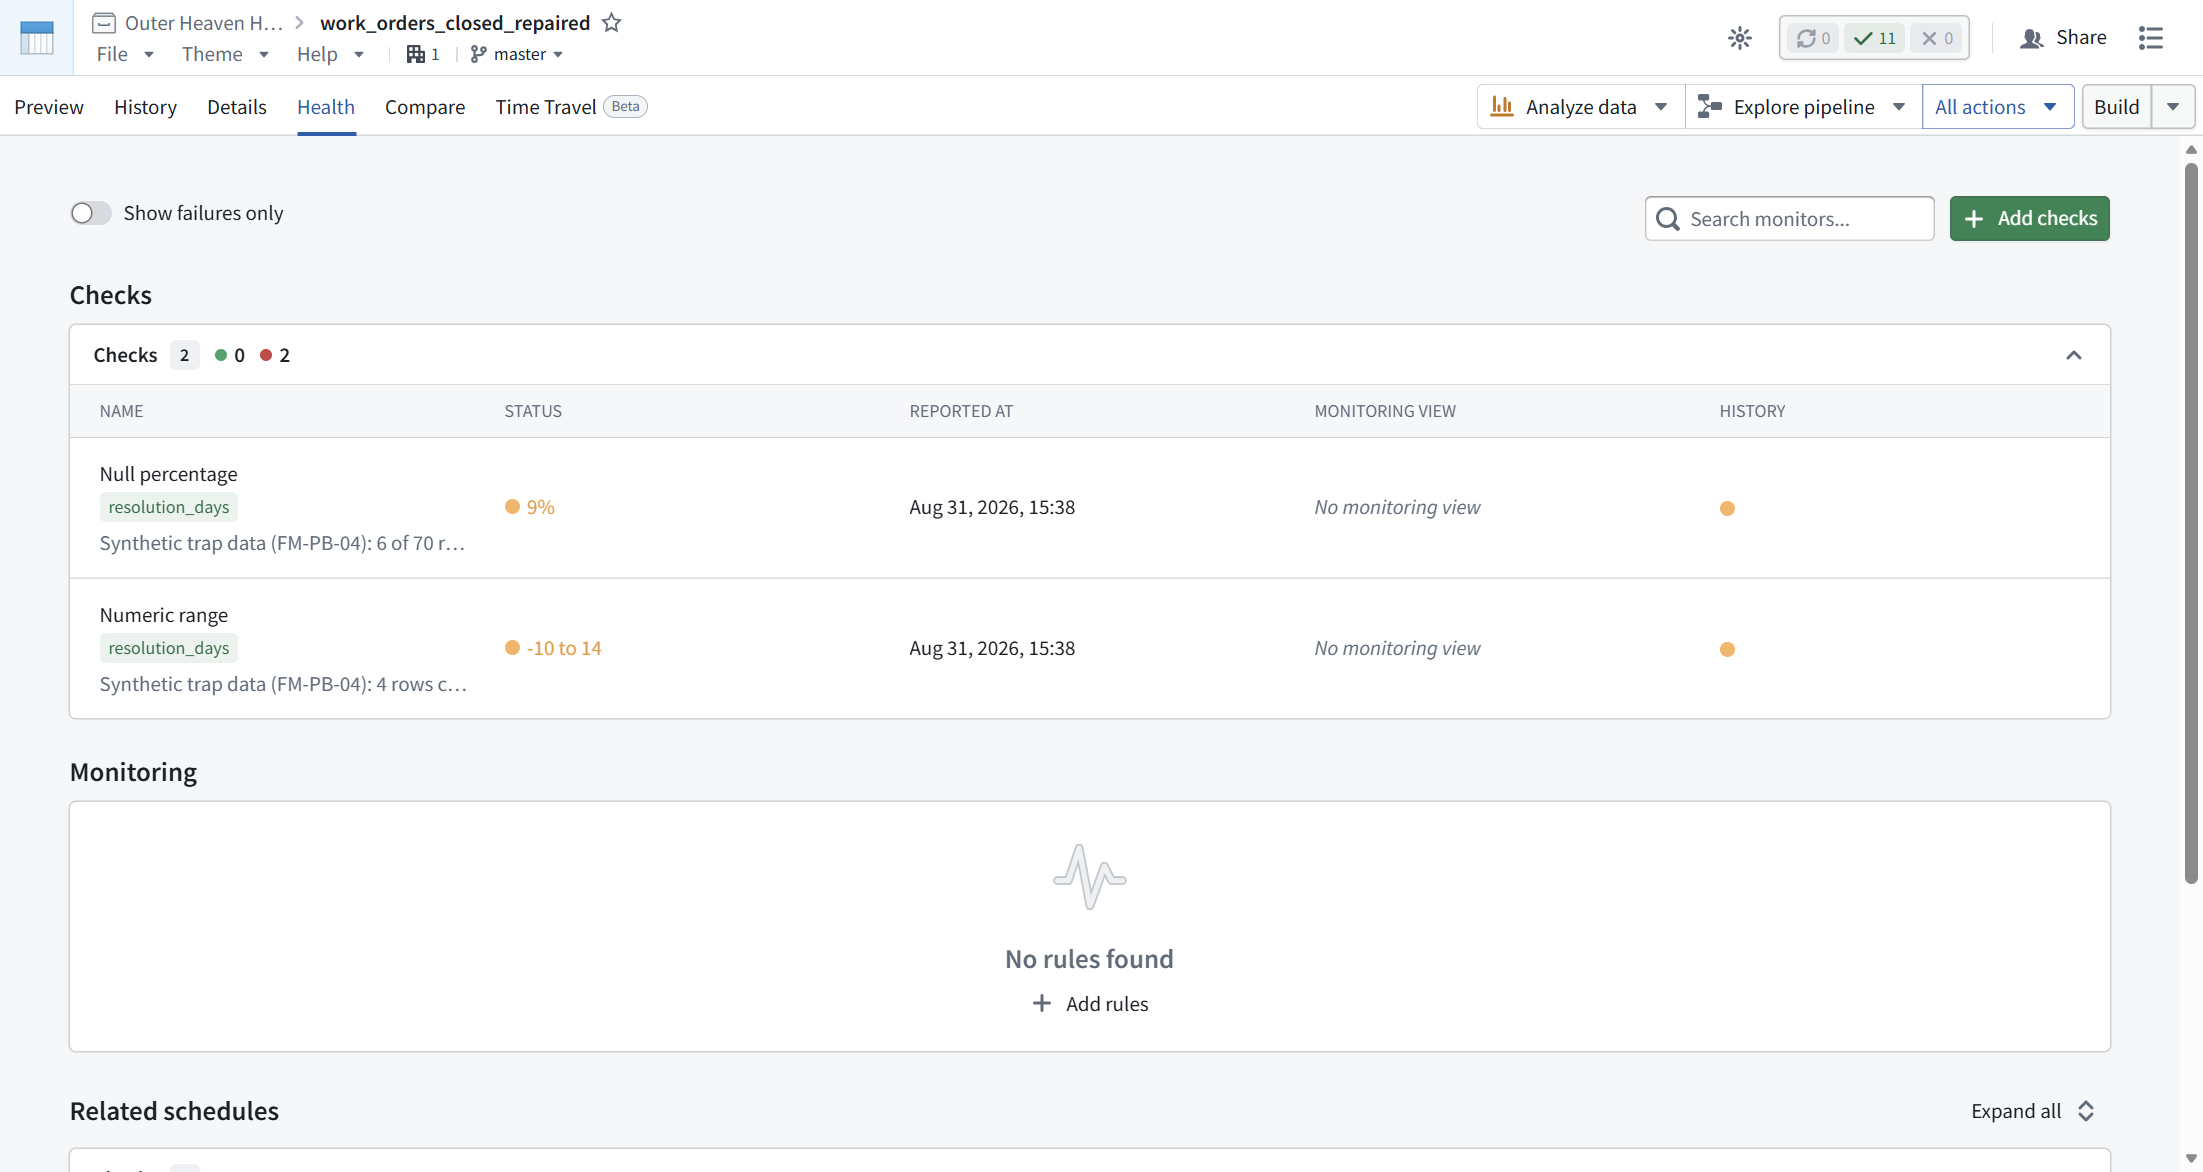
Hold the two screens together: History says 2 succeeded, 0 failed; Health says 2 failing checks, and the dataset header shows a red counter. Both are true at once because they measure different things. A build job computes and writes data. A health check measures the written data against your rule and reports. Failing checks do not block the build, do not fail the build, and do not mark the transaction bad. Observation, not enforcement.
The check detail panel is worth knowing before you need it: click a check row (the REPORTED AT cell works) and a side panel opens with an "All failures" dropdown, an Edit link, a "Monitoring views" line (ours: "Not included in any"), the last run time, the check RID (ri.data-health.main.check...), and a small bar chart of metric history.

[ STEP 7: ESCALATION IS A SEPARATE DECISION ]
If failing checks change nothing by themselves, the obvious question is how anyone finds out. The answer is an opt-in on the check itself. Open the check's edit dialog and find the Issues section: "Automatically create an issue when this check fails".
Enabling it reveals three controls:
- An assignee search field. We assigned Yousuf Zakhel.
- "Automatically close the issue when this check passes again", pre-checked. Sensible default; leave it.
- "Map alert severities to issue priorities", unchecked. We left it unchecked and did not test it; noted here as untested.

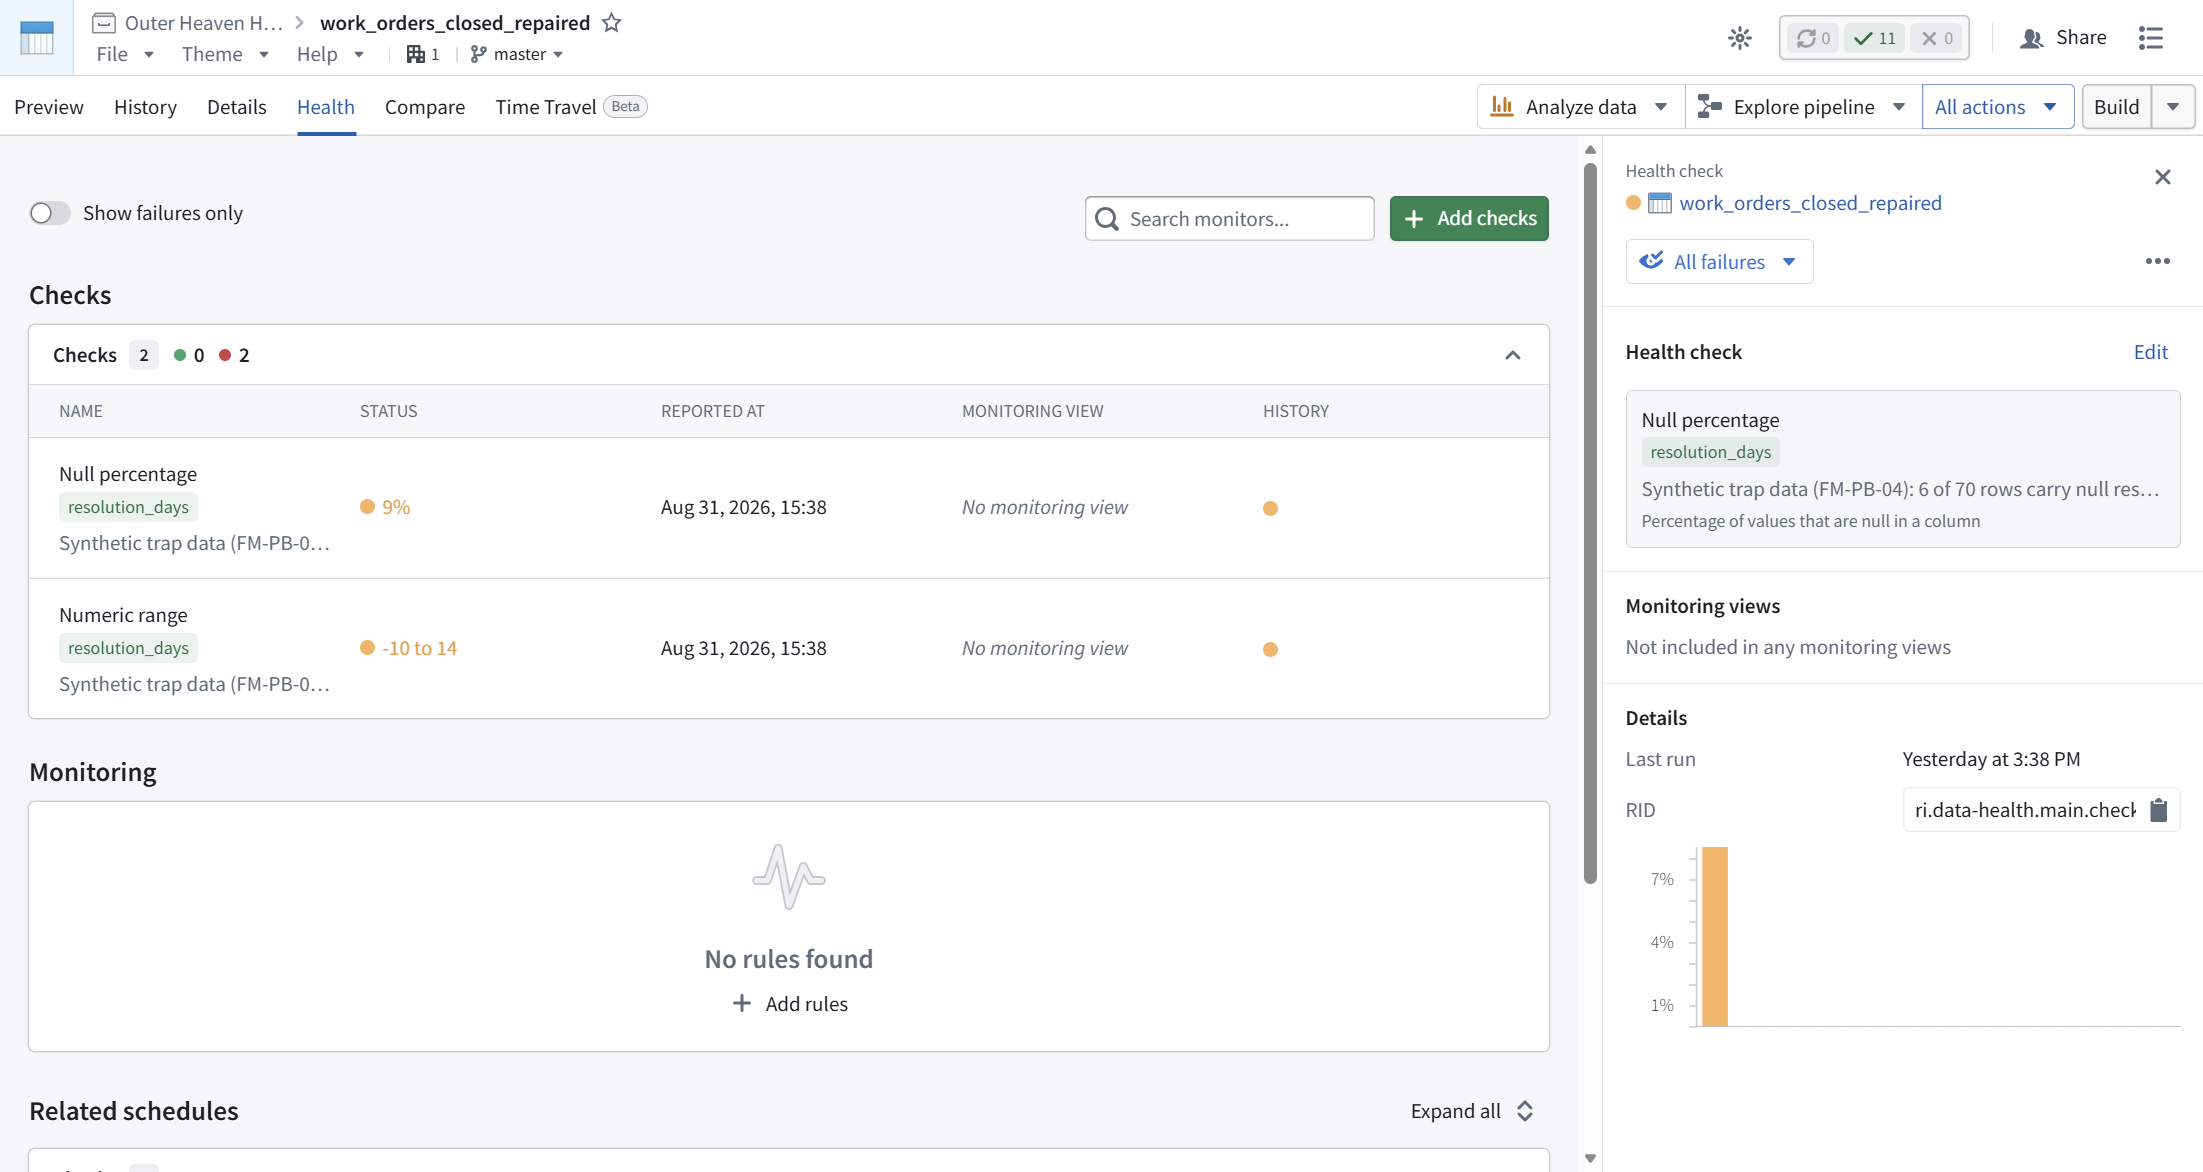
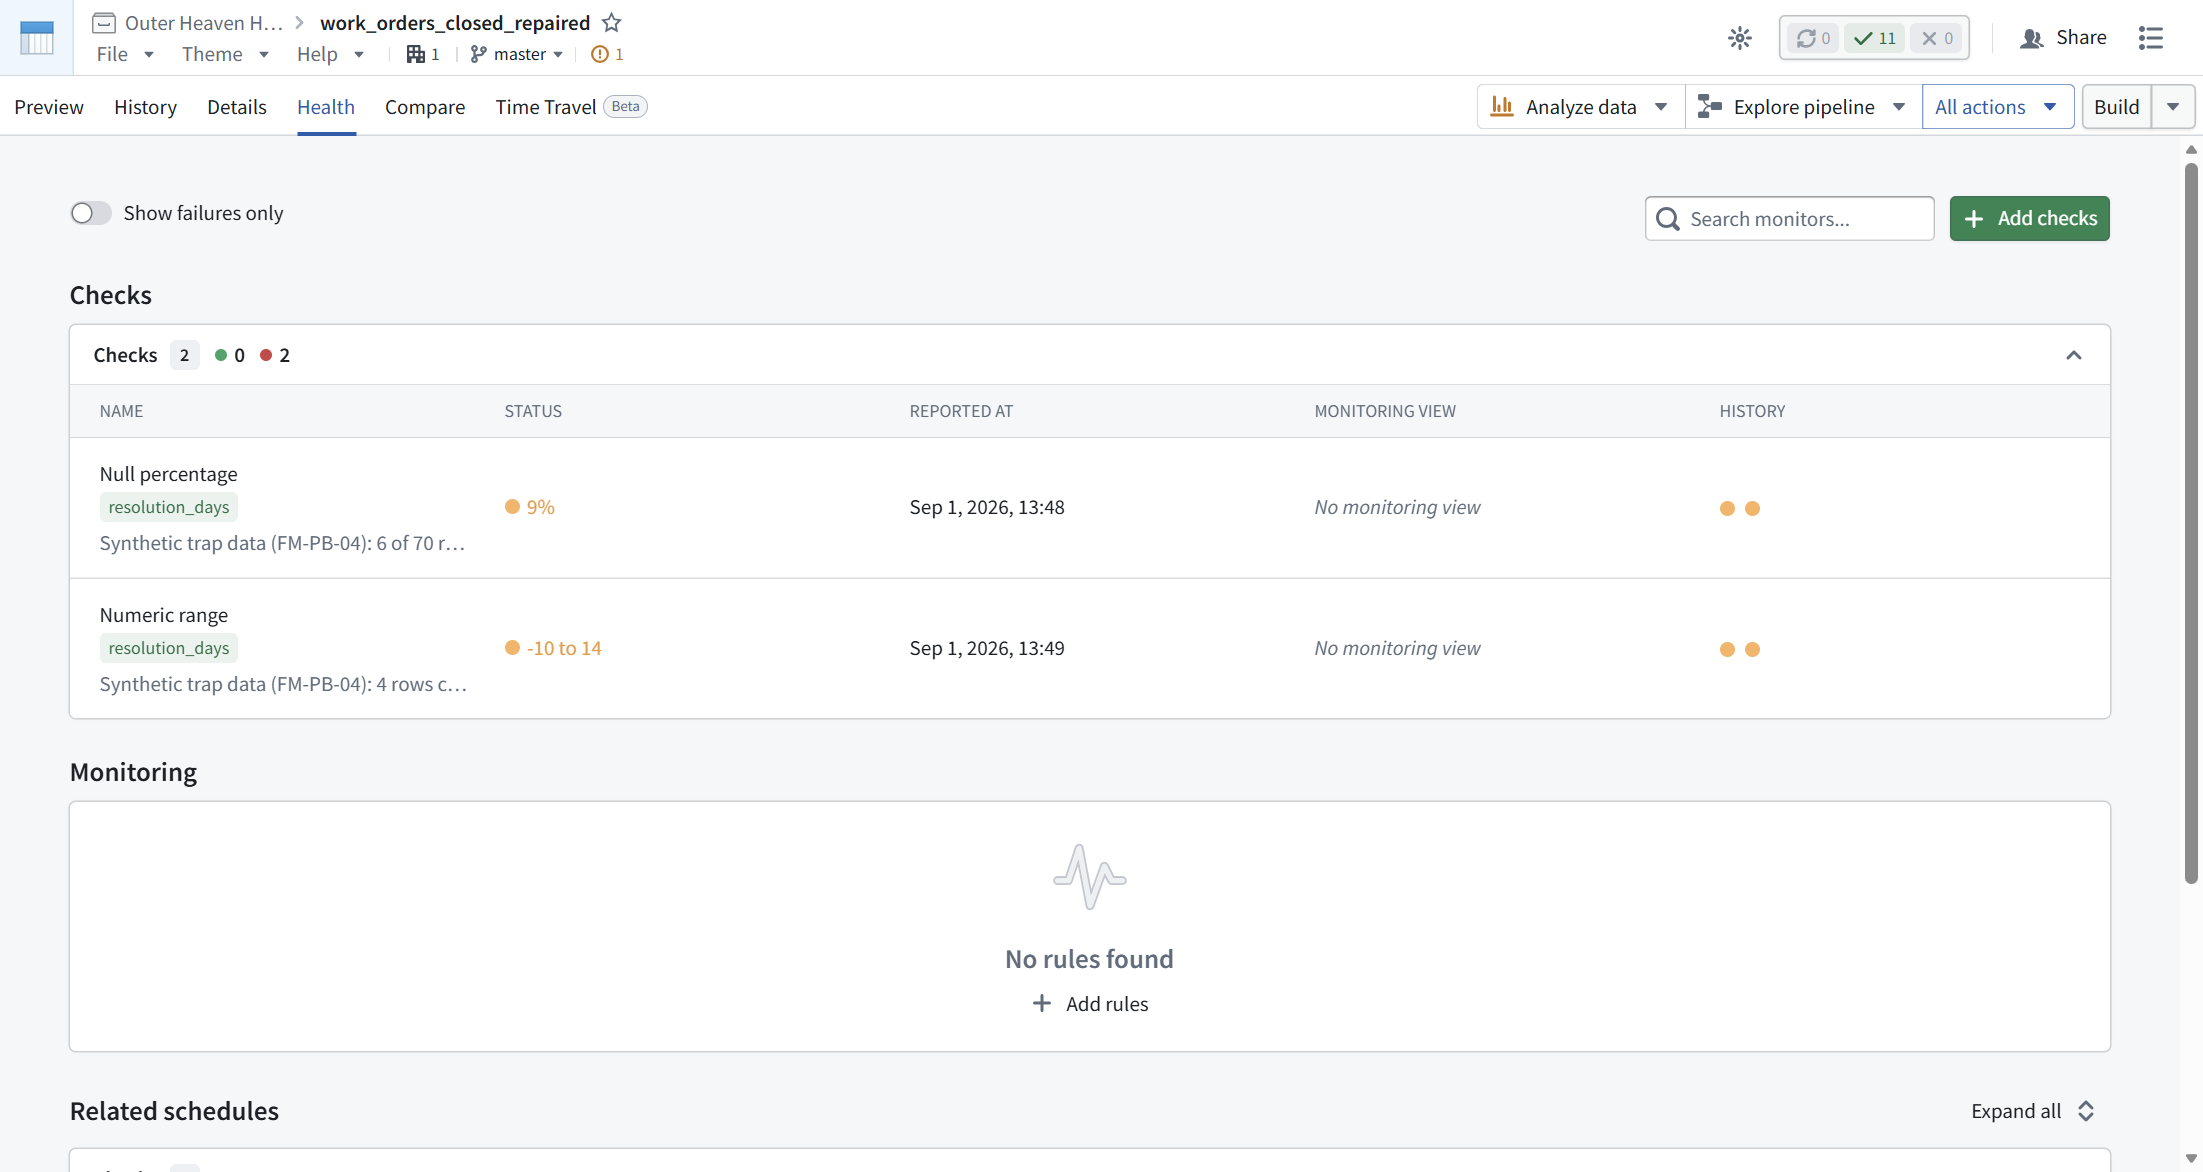
Save, then force another rebuild so the check re-evaluates (same caret menu as Step 5). The checks re-reported, still failing, timestamps Sep 1 2026, 13:48 and 13:49, and the History column on each check now shows two dots, one per evaluation. Then the visible signal: an orange badge reading "1" appeared in the dataset header, next to the master branch name. Clicking it opens a popover, "Open issues (1)": "Null percentage check failed. Reported by data-health 6 minutes ago." with a "View all open issues" link.


[ STEP 8: THE ISSUE IS THE HANDOFF ]
Issues is a dedicated application in the left sidebar, under Applications. Filtered to our dataset it shows one row: "Null percentage check failed", created by data-health, status "Awaiting triage", priority "Medium" (mapped from the check's Moderate severity), assigned to Yousuf Zakhel automatically.

Open the issue and the handoff is complete. The page (RID ri.issues.main.issue.800acfc4-3733-4104-9e5e-bd6a9a9b54c0) contains:
- Title: "Null percentage check failed". Attribution: "data-health reported on work_orders_closed_repaired master", timestamped Tue Sep 1 2026, 1:48:42 PM.
- A measured body line: "Null percentage check failed. 8.57% is larger than the upper bound 0.00%." The Health table rounds this to "9%"; the issue carries the exact figure.
- The check's note text, verbatim, under "Notes:". This is why Step 3 told you to write notes for the person who gets paged: the note is the first thing that person reads.
- An embedded dataset card: built Tue Sep 1 2026, 1:47:50 PM, 70 rows, 12 columns, with an "Explore data lineage" link and a live preview grid showing the offending nulls in place.
- A triage sidebar: Support type, Status, Priority, Assigned, Labels, and an "AIP Assist tools" button.

Check, failure, issue, owner, evidence. The loop closes without leaving the platform.
[ FIELD REPAIRS ]
FR-1. A Numeric range check cannot save a single bound of exactly 0. What happened: Numeric range on resolution_days, comparator "at least", bound 0. Save stayed disabled with the tooltip "Must specify either an upper or a lower bound", even though a bound was on screen. We verified this is a real falsy-value defect, not a stale form state: with a full React commit of the input, 0 keeps Save disabled while 1 enables it immediately. The fix: switch the comparator to "in between", set the lower bound to 0, leave the upper bound blank. Semantically identical to "at least 0", and Save enables. Verified live; the check saved and evaluates correctly. Lesson: the workaround costs nothing, so do not fight the field. Control experiment for the record: Null percentage "at most 0%" saves fine with saveDisabled=false, so the defect is specific to Numeric range single-bound. Almost certainly a truthiness check on the bound value somewhere in the form logic.
FR-2. A saved check says "No results yet" forever, until you make it not forever. What happened: both checks saved cleanly, then sat at "No results yet". Nothing was wrong; checks evaluate on the next transaction, not on the data already written. Meanwhile the Build button refused to help: "Build not started. The dataset is likely already up to date." The fix: caret menu next to Build, check Force (warning icon and all), click "Only this dataset". That creates the transaction the checks are waiting for. Lesson: on a quiet dataset, health checks are inert. If you add checks to a dataset that rarely rebuilds, also decide what will ever trigger an evaluation: a schedule (FM-PB-03), an upstream update, or a manual Force.
FR-3. Cloud sessions expire overnight, again. What happened: the day 1 session died at the passkey screen (same as FM-PB-02 FR-3), and day 2 started with a fresh login. Checks, notes, and severity settings all persisted; they are saved platform state, not session state. The fix: none needed beyond the account owner re-authenticating. The SESSION_LOG carried the resume state, as designed.
[ FAQ ]
So what actually stops bad data from shipping?
Not health checks. A failing check changes a counter and, if you armed it, creates an issue. The build succeeds either way; we watched it happen twice. If you need hard enforcement, that is pipeline-level logic: filter or quarantine boards of the kind FM-PB-02 built, or downstream consumers gated on check status through your own orchestration. Checks tell you. Pipelines act.
Moderate or Critical, does it matter?
For behavior, no. Both observe, neither blocks, and there is no third option. The severity feeds alerting wording and, if you enable it, the optional severity-to-priority mapping on auto-issues (untested here). Our auto-created issue landed at priority Medium from a Moderate check with the mapping off.
My check shows "No results yet". Is it broken?
No. It is waiting for the next transaction on the dataset. Force a build (caret menu, Force, "Only this dataset") to evaluate on demand.
Can I fix a check's columns after saving?
No. Columns are immutable at save time, and the platform says so twice, once on a banner before you save and once in the edit view after. To change columns you delete the check and write a new one. Bounds, severity, notes, and the auto-issue settings stay editable.
Where do I look first when a check fails?
The dataset header. A red counter appears next to the branch name when checks fail, and an orange issues badge appears there when auto-issues fire. Pipeline Builder will not tell you anything; its graph carries no health badge even with two checks failing on its output.
What was not tested?
Critical severity alerting, the "Map alert severities to issue priorities" option, auto-close-on-pass (armed, but our data still fails, so no close event occurred), monitoring views, "Customize build...", and Full build. The module claims nothing about them.
[ NET POSITION ]
Two checks on a 70-row synthetic dataset, both failing by design, taught the whole doctrine. Health checks live on datasets, not in pipelines. They evaluate on transactions, not retroactively. They report with measured values and carry your notes into the issues they raise. And they never, at any severity, stop a build. Treat them as tripwires: they exist so that a human with a name finds out, fast, with evidence attached. If you need the data itself held back, build that gate in the pipeline, where gates live.